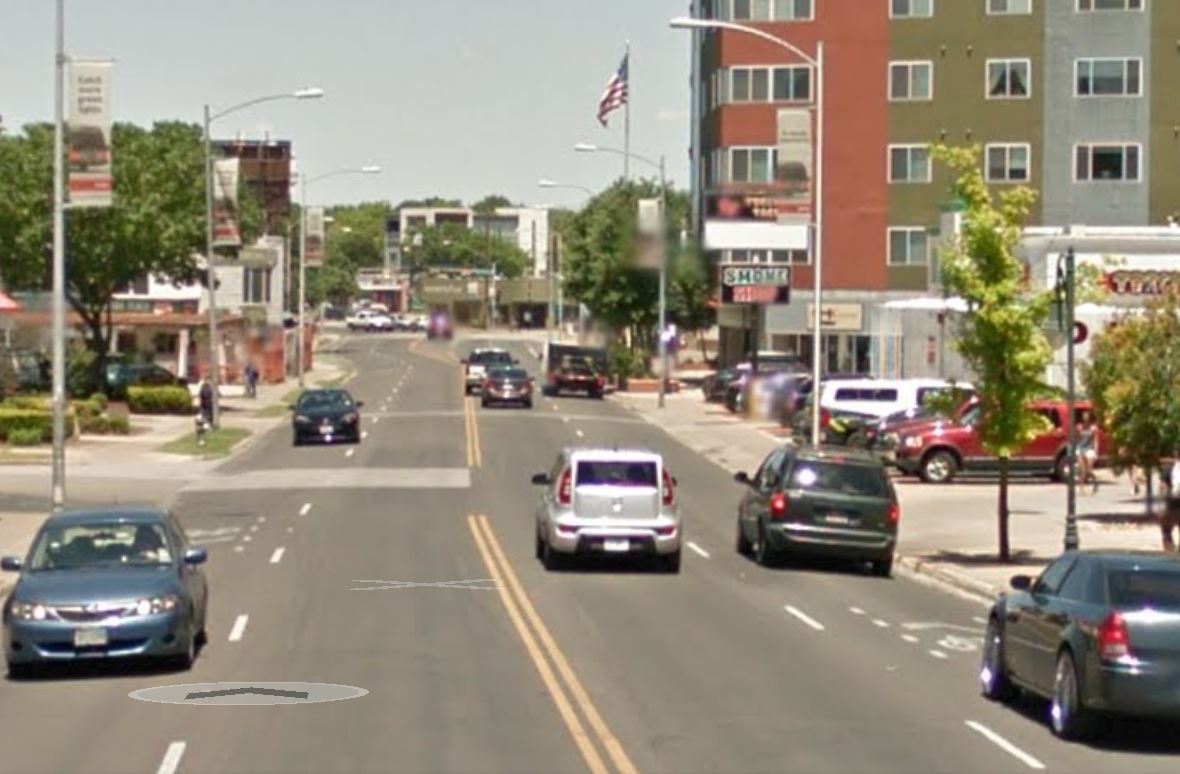
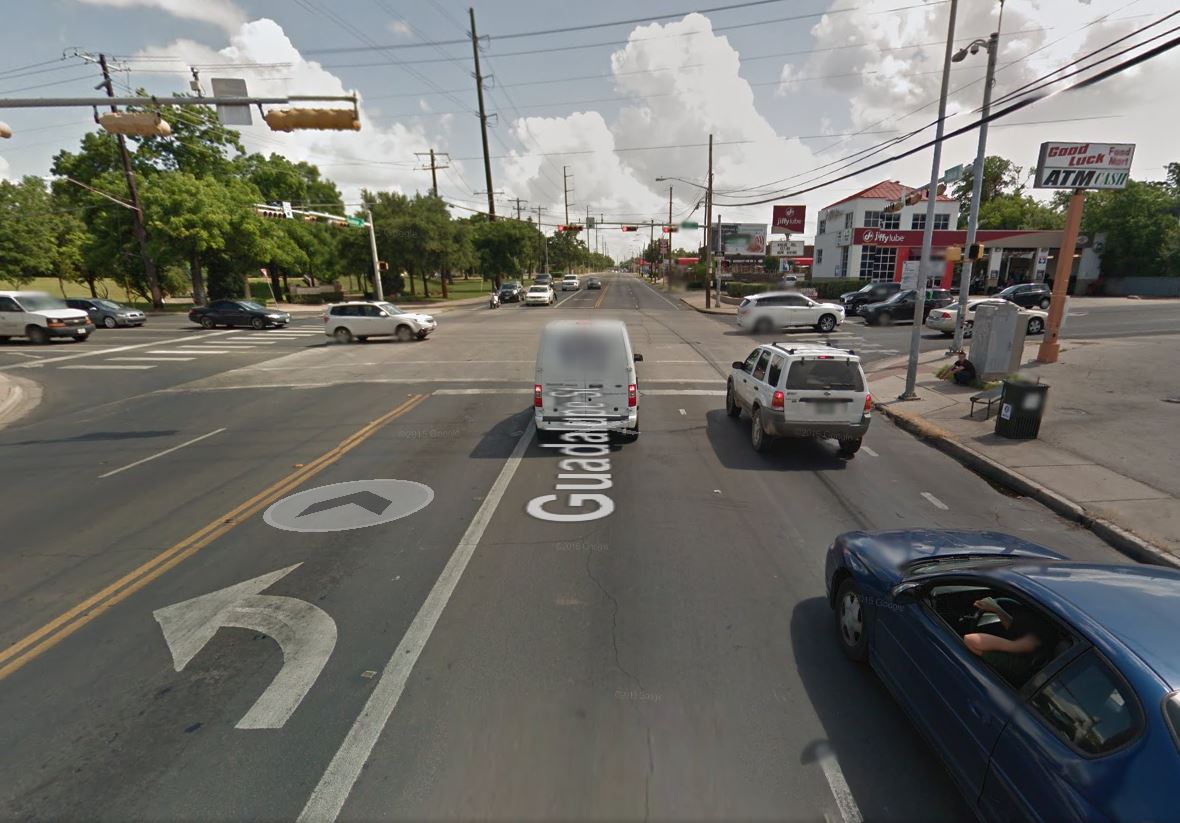
Guadalupe St., near W. 28th St. Graphic: Google Street View.
♦
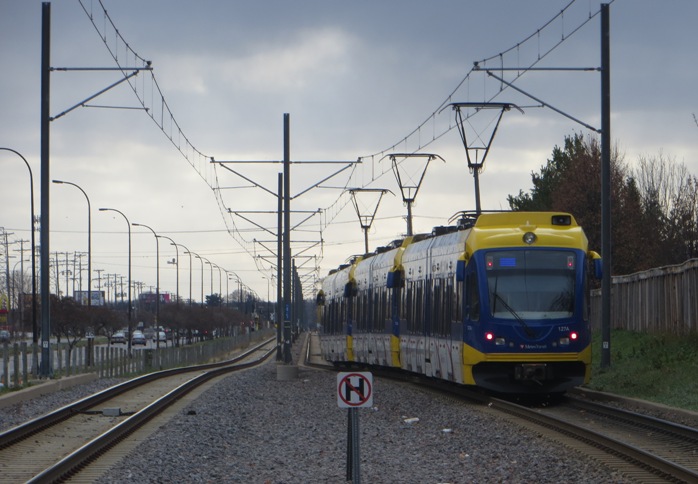
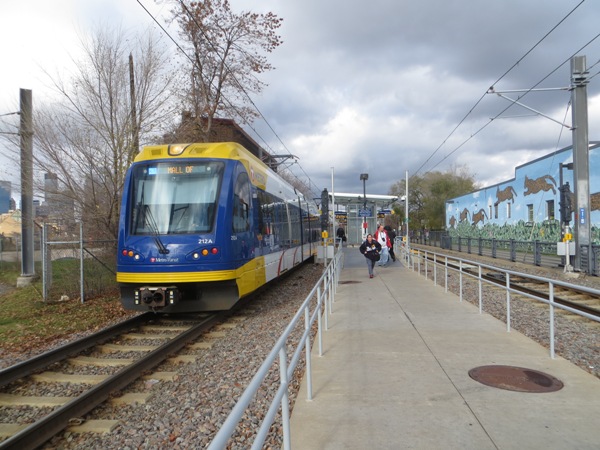
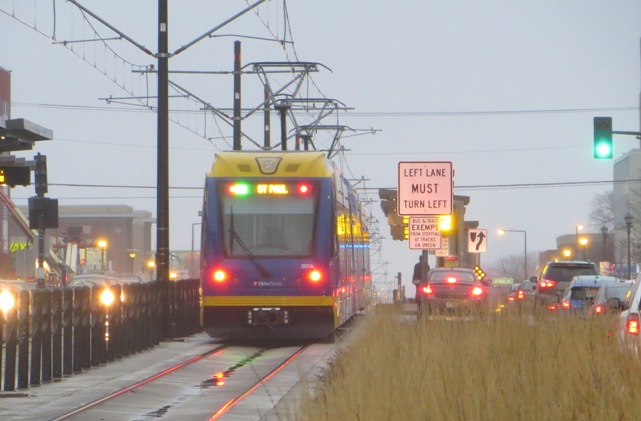
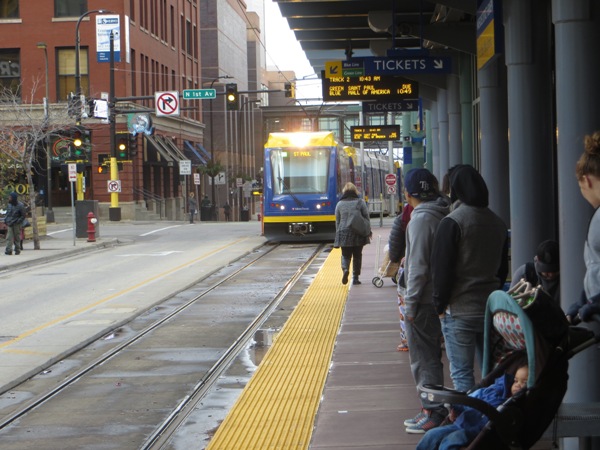
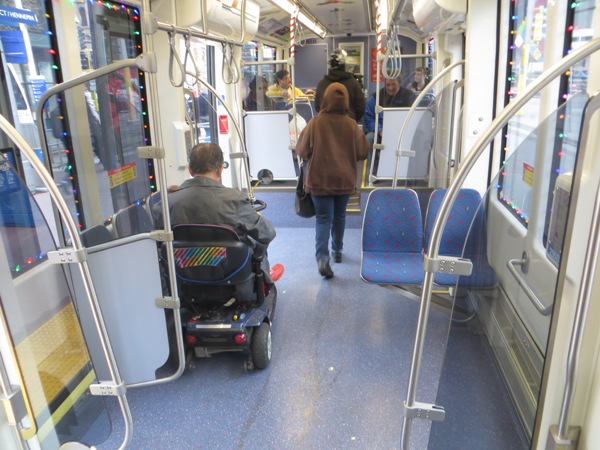
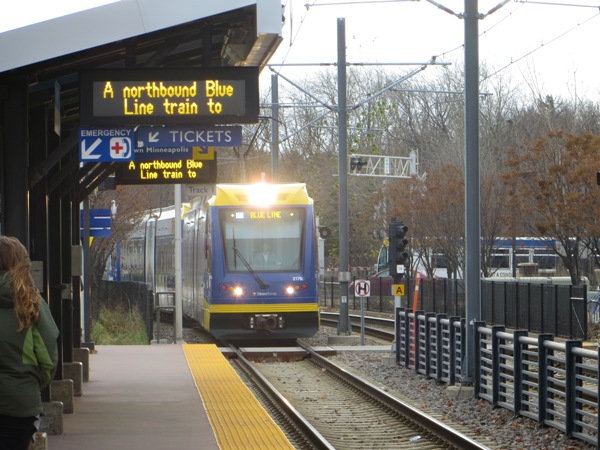
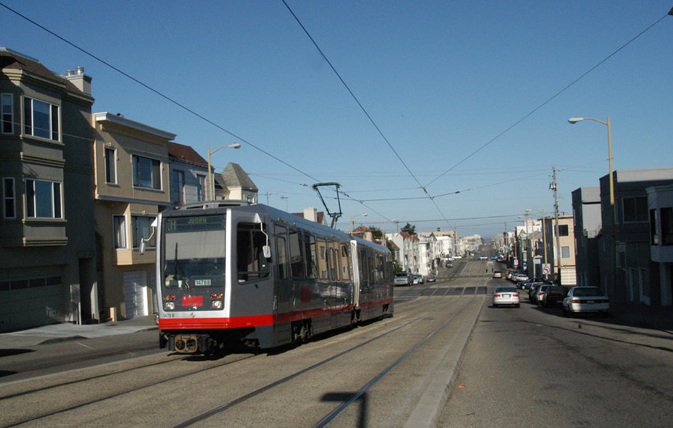
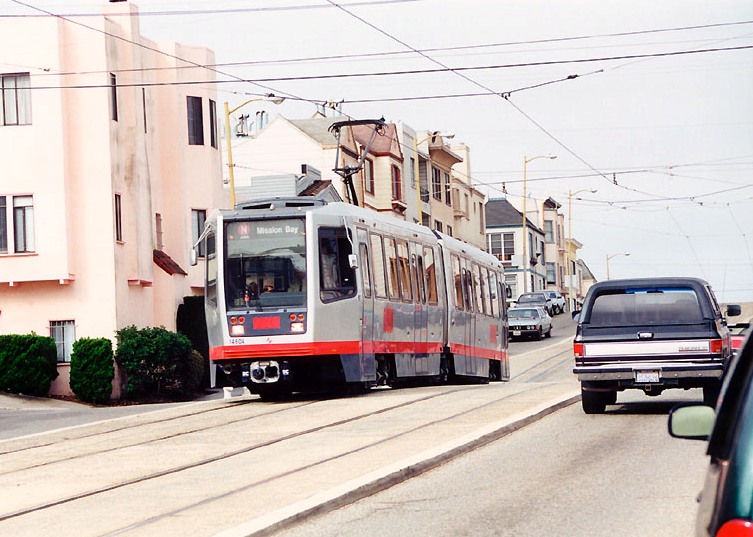
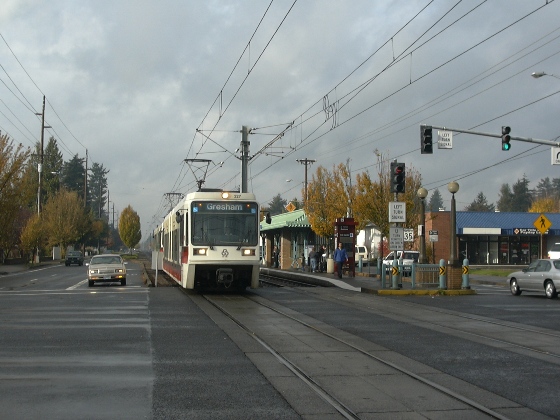
As Austin Rail Now has repeatedly pointed out, there are various ways that a starter light rail transit (LRT) line could be fitted workably into the Guadalupe-Lamar corridor. In our December 2014 article «San Francisco’s N-Judah Muni Metro line shows design option for light rail in Austin’s Guadalupe-Lamar corridor» we suggested a design alternative with the objective of inserting dedicated LRT lanes while minimizing disruption and cost and maintaining four traffic flow lanes. In this, we showed how a San Francisco LRT design could serve as a model for installing a dedicated LRT alignment in the relatively narrow 80-foot width of the Guadalupe-Lamar corridor (see illustrations below).
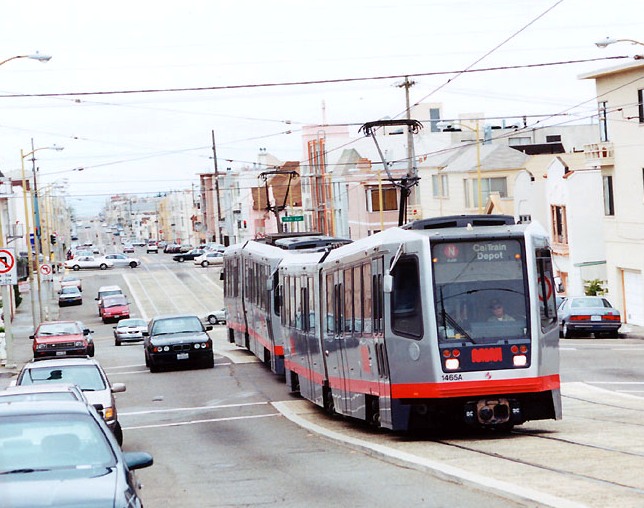
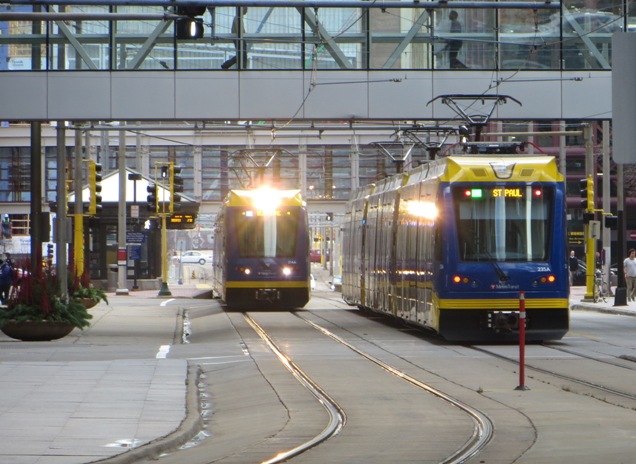
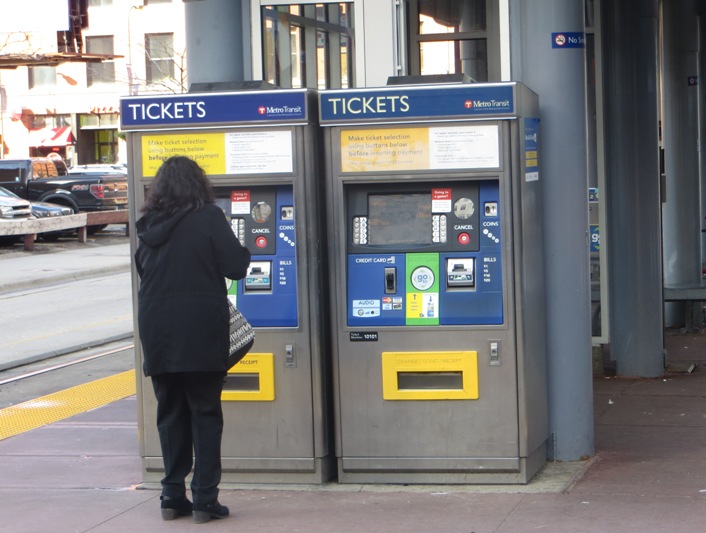
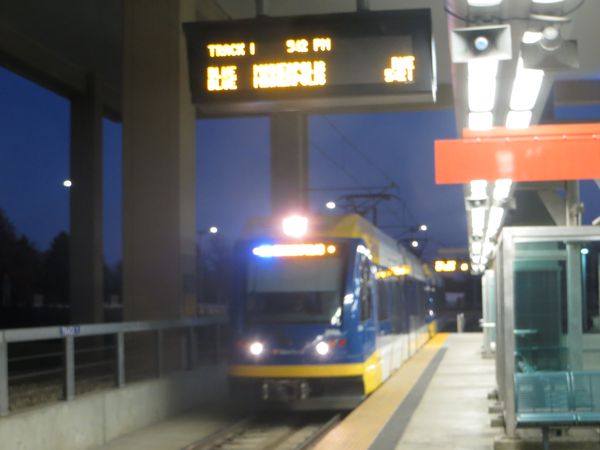
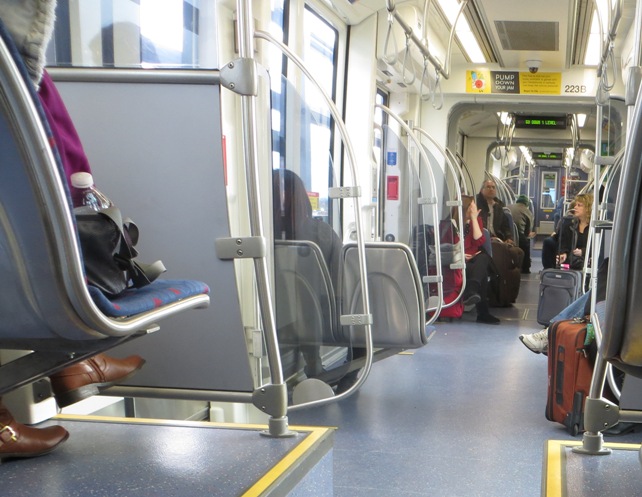
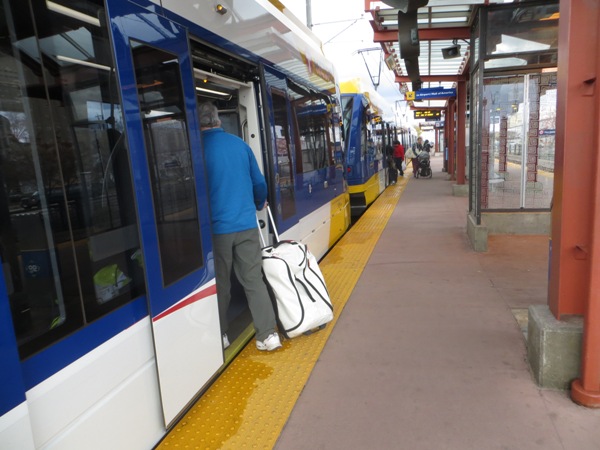
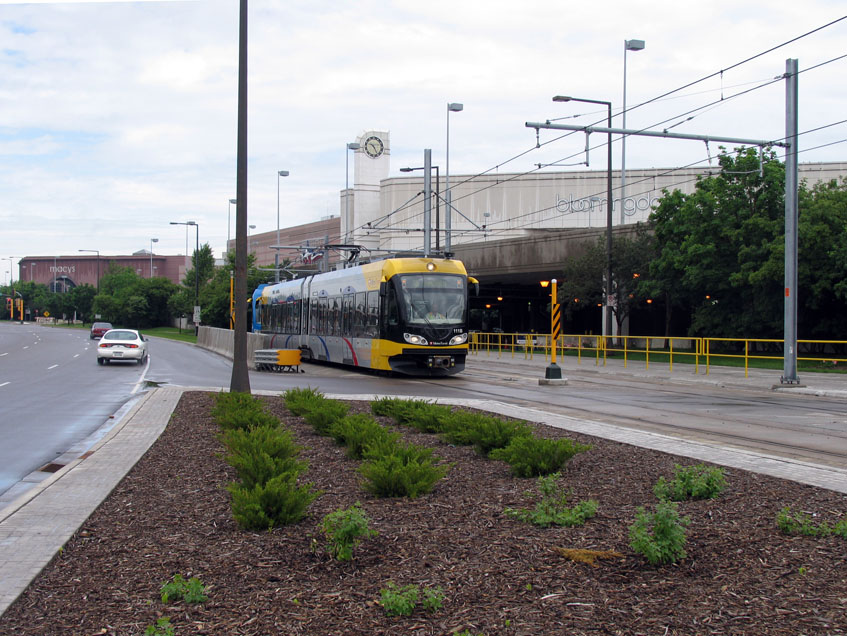
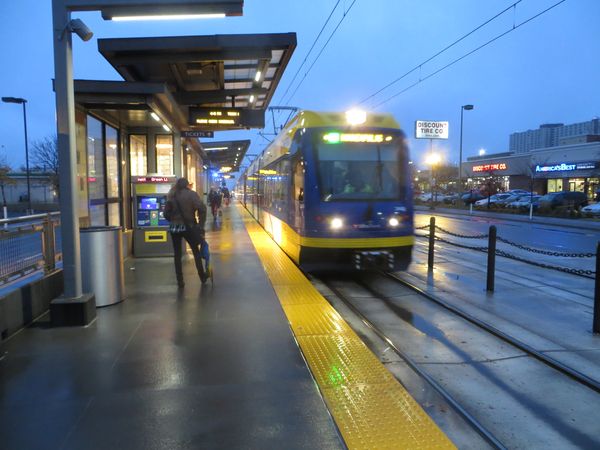
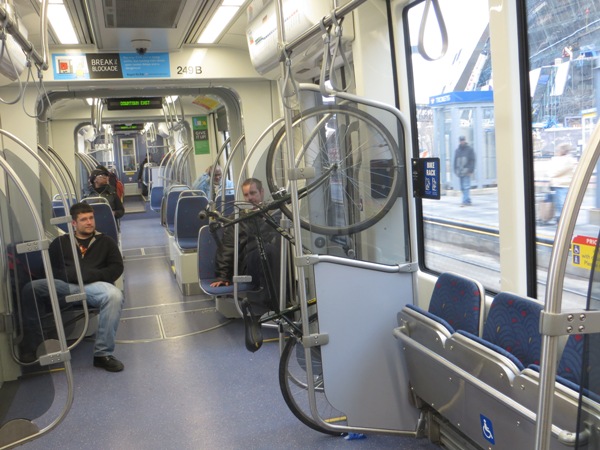
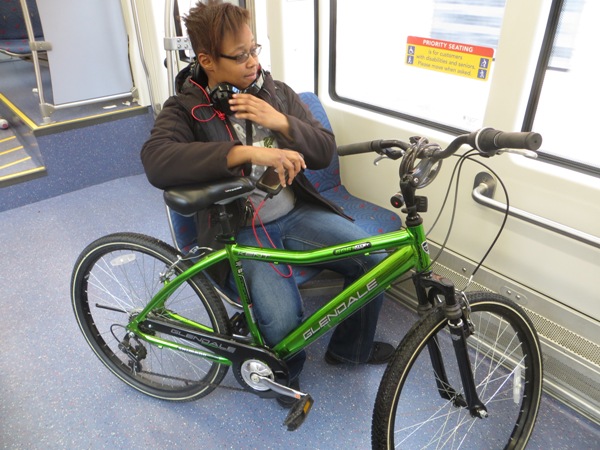
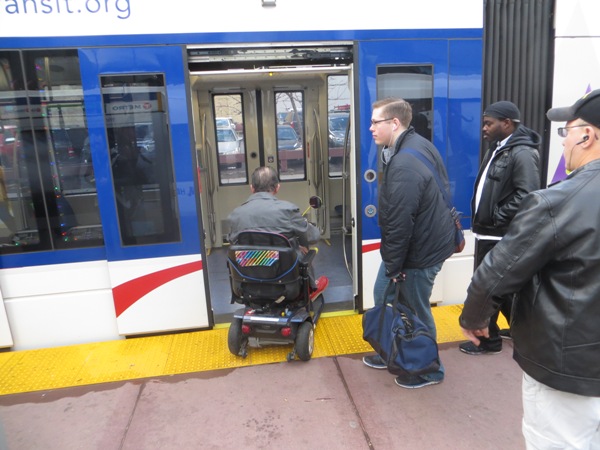
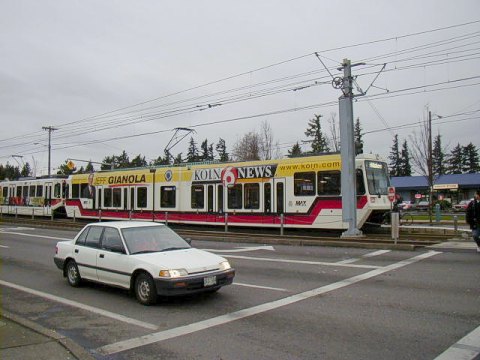
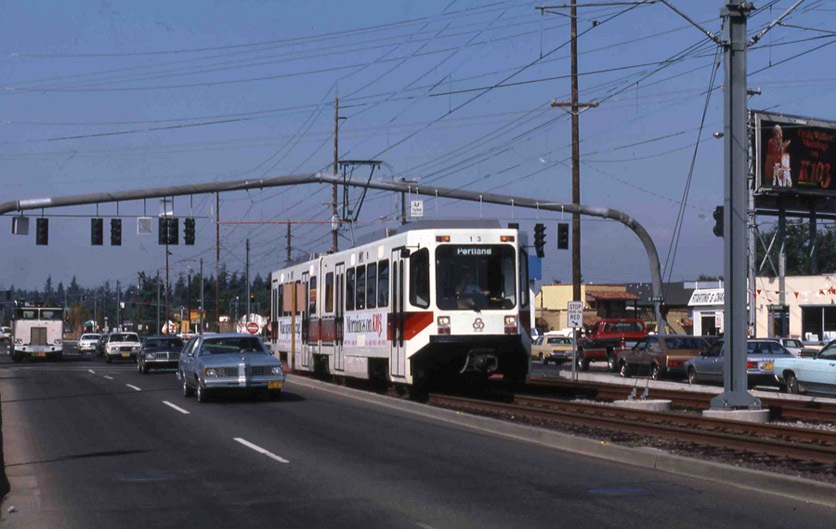
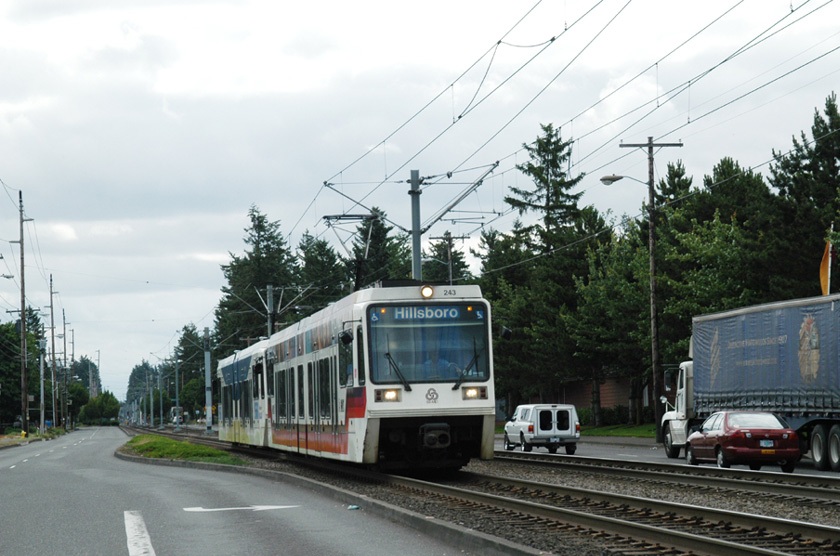
San Francisco’s N-Judah LRT line could serve as design model for Austin’s Guadalupe-Lamar corridor. Photo (copyright) Eric Haas.
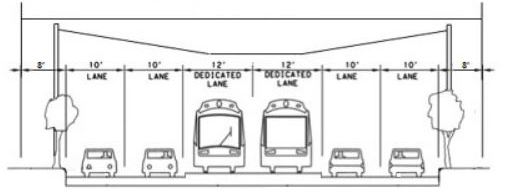
ARN’s proposed design shows how LRT, plus 4 traffic lanes and pedestrian/bicycle facilities, could be fitted into relatively narrow Guadalupe-Lamar corridor. Graphic: ARN. (Click to enlarge.)
This past December, another design proposal was made public by Austin community urban activist and Guadalupe-Lamar rail transit supporter Andrew Mayer. Compared to Austin Rail Now’s relatively minimalist approach, Andrew’s design is considerably more ambitious — with undoubtedly more urban impact and capital expense — but it embodies good ideas and hints at the kind of range of optional approaches available to ensure that LRT will work in this key central corridor.
As Andrew explains, “For those who are interested in urban rail along Guadalupe and Lamar … I made a bunch of detailed cross-sections with streetmix several months ago.’ These are posted on the Imgur online image sharing community and image host site: http://imgur.com/a/gsa2n. In this post, we’ll illustrate Andrew’s proposal with sample graphics selected excerpted from his presentation. (Occasional stations are selected to illustrate typical proposed station design.)
Complete Streets approach
While almost any design proposing insertion of dedicated lanes for LRT into this corridor would represent to some extent a Complete Streets approach, Andrew’s proposal seems to be a particularly large-scale and aggressive implementation. As he elaborates,
I feel like these designs are relatively ambitious (2 transit lanes, 4 auto lanes, 2 separated bike lanes, 2 12 ft sidewalks along most of its length), but revamp Guadalupe and Lamar into more complete streets, while seeing if I could retain the existing number of auto lanes. Some of these ideas I came up with way back in 2009 (i.e. the split direction of traffic along west campus, the wide boulevard between 38th and 51st st), some are more recent.
Regardless how much you agree or disagree with these designs, I hope this contributes to the discussion of rail on Guadalupe/Lamar, as I feel like detailed discussion of street design is warranted if there is going to be a push to get [Guadalupe/Lamar/Congress] urban rail on the ballot as soon as possible.
Illustrating this approach is Andrew’s proposal for making the Drag more hospitable to LRT, pedestrian, and bicycle traffic by moving southbound traffic off of Guadalupe and onto either Nueces or “possibly” San Antonio St. (see map below). Andrew notes that “Relatively slow traffic (25 mph) due to traffic calming measures … makes street pedestrian friendly despite higher traffic volumes.”
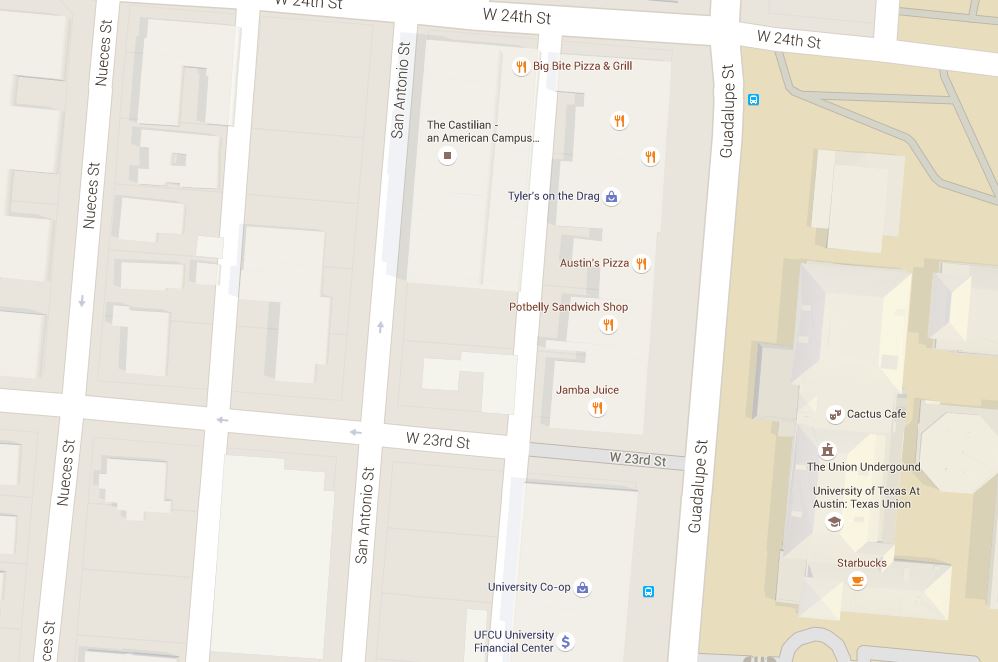
Map snippet shows Guadalupe St. at right (east), with University of Texas campus bordering on east side; San Antonio and Nueces St. in West Campus neighborhood (west of Guadalupe). Andrew Mayer’s design proposes moving southbound traffic from the Drag onto either Nueces or San Antonio. Graphic: Google Maps. (Click to enlarge.)
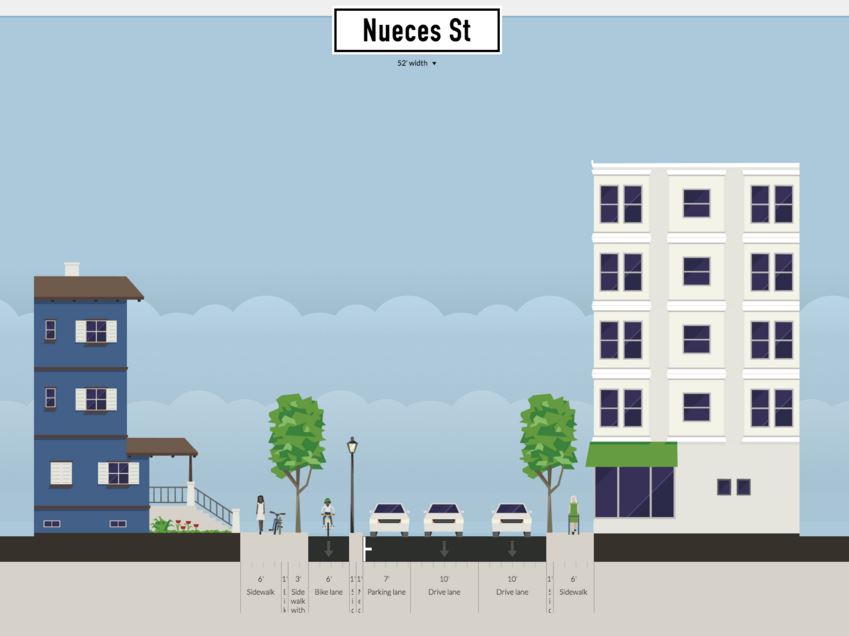
Proposed southbound traffic moved from Guadalupe to Nueces St. Graphic: Andrew Mayer. (Click to enlarge.)
The Drag (West Campus)
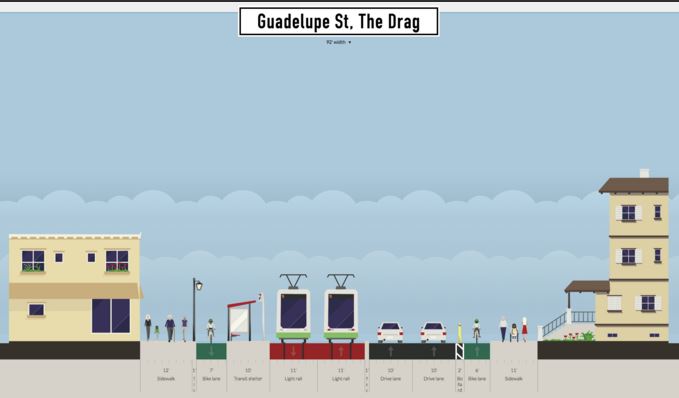
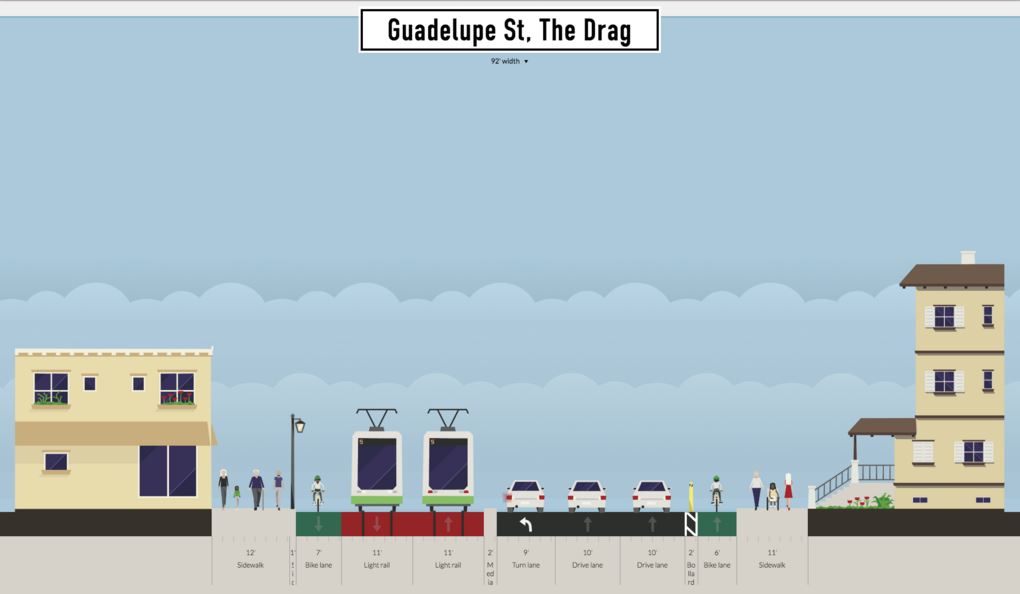
As illustrated below, Andrew’s proposal for the main Drag segment (bordering the West Campus neighborhood) seems to envision dedicated LRT lanes occupying the west side of the street (former southbound lanes, with traffic now moved to either Nueces or San Antonio St.). Traffic lanes are narrowed to 10-ft width. Andrew comments: “Bike lane stays pretty much the same, but the parking lane and current southbound lanes are used for transit lanes. Northbound lanes are pushed slightly westward to allow for a separated bike lane and wider sidewalk.”
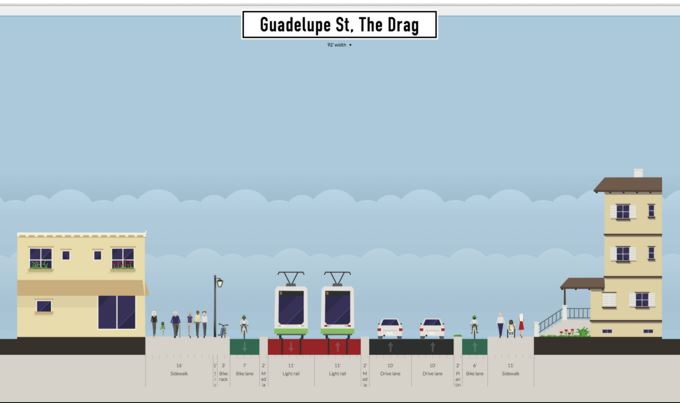
Proposed LRT alignment along Drag. Graphic: Andrew Mayer. (Click to enlarge.)
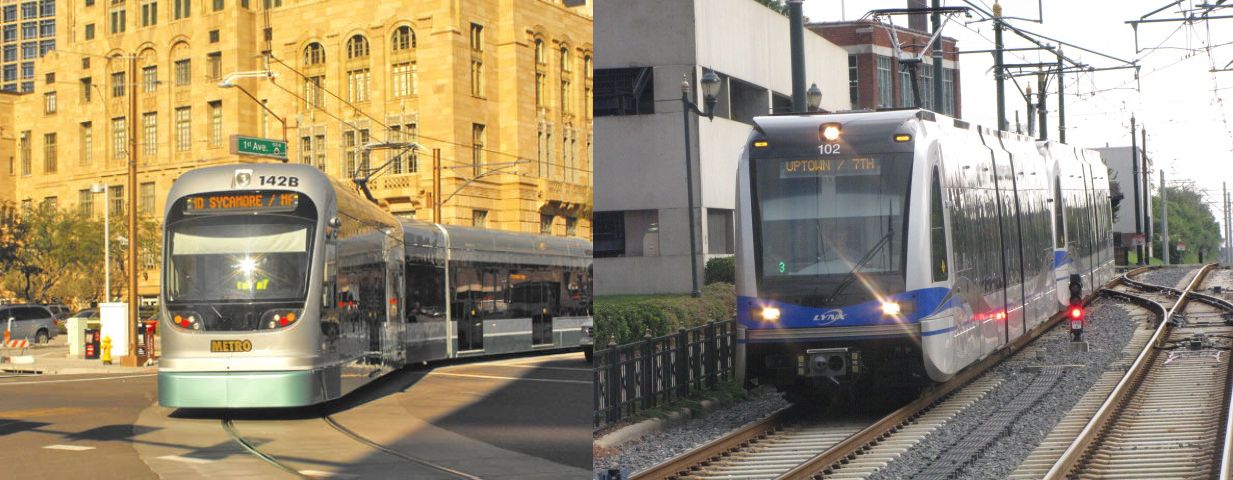
In this proposal, space for station platforms appears to be appropriated from pedestrian/bike space. It’s not explicit in Andrew’s design, but station platforms would likely be staggered across intersections (a common space-conserving technique in LRT design). Andrew also suggests that “platform” space might be allocated to use as a turning lane for motor vehicles (although this could conflict with the need for a station platform at that same point). Another option, deployed in Houston Metro’s MetroRail LRT design, is to allow a turn lane to share the LRT track (with traffic signal control coordinated with train movements — discussed briefly in our article «Houston’s MetroRail shows the way — How to fit urban rail into Austin’s Guadalupe and Lamar»).
Andrew comments that “In this design, there are two platforms and both open on the right side of the vehicle.” Andrew also suggests the possibility that “the idea was that some buses would also use the transit lanes (i.e. 803, 3, other bus lines that feed onto Guadalupe) and thus the right-hand platforms would be compatible with buses that only have doors on the right-hand side.” However, while sharing of lanes between buses and LRT is entirely possible and done in some situations, sharing where there is high-frequency service by both modes is not advisable. (Our own design proposed center-street running with allocation of at least a single curbside lane on each side for local bus access.)
Proposed 24th St. station (southbound direction). Graphic: Andrew Mayer. (Click to enlarge.)
Proposed LRT alignment on Drag at 24th St., with possible turning lane. Graphic: Andrew Mayer.(Click to enlarge.)
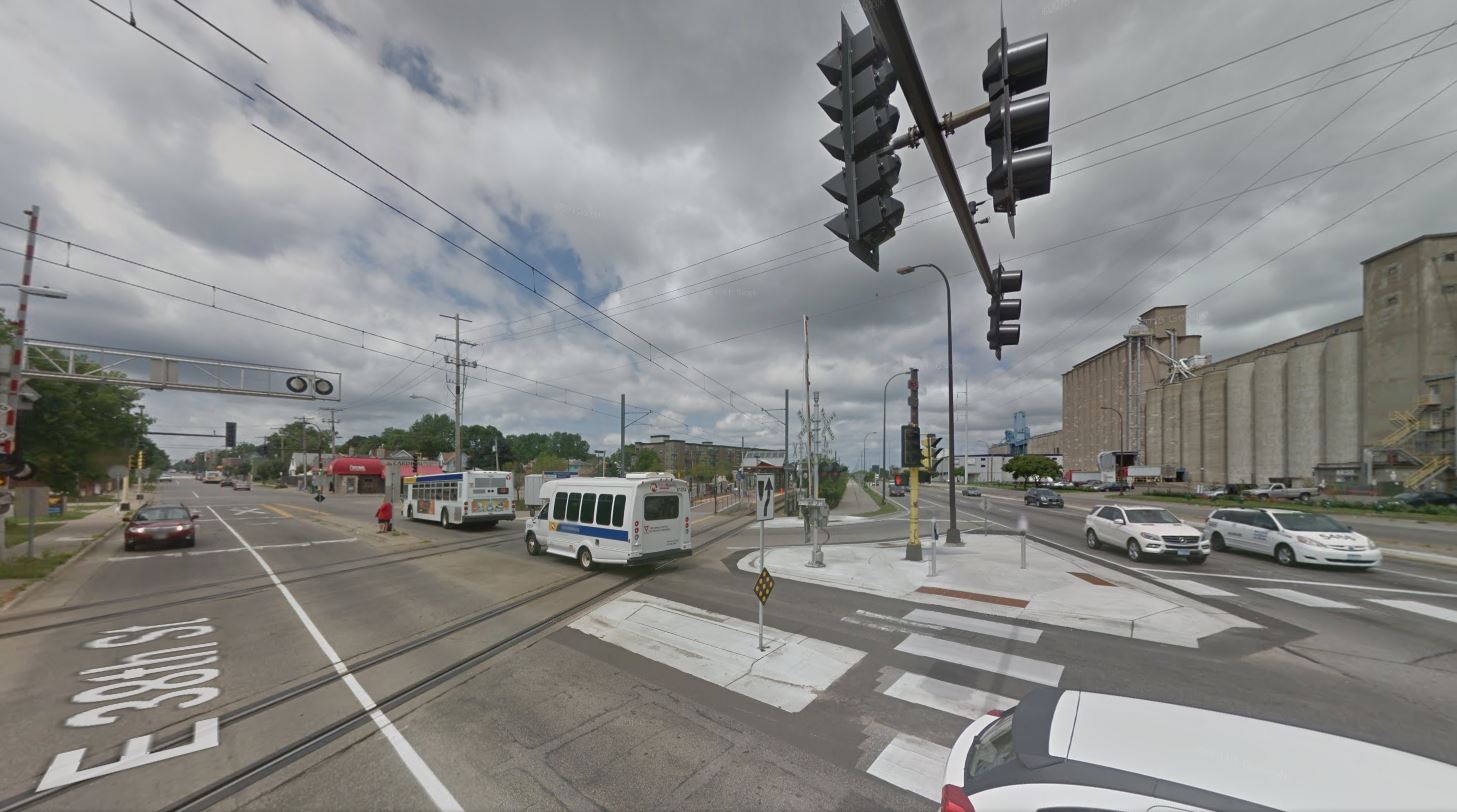
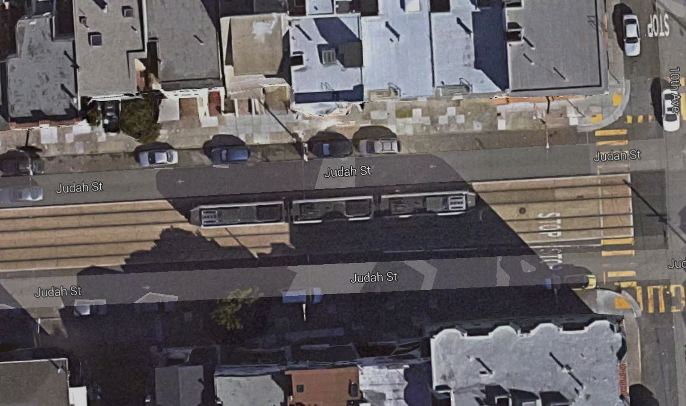
Between 24th and 29th St. (Andrew calls this the North Drag), Guadalupe narrows somewhat, constricting the space for LRT as well as pedestrian and bike facilities (see streetview at top of post, and aerial view, below). Andrew’s solution is to rely on the fact that southbound traffic has been re-routed to other streets; he also narrows the sidewalks and assumes that the bicycle route can be re-routed through this section to an available parallel street (Hemphill Park).
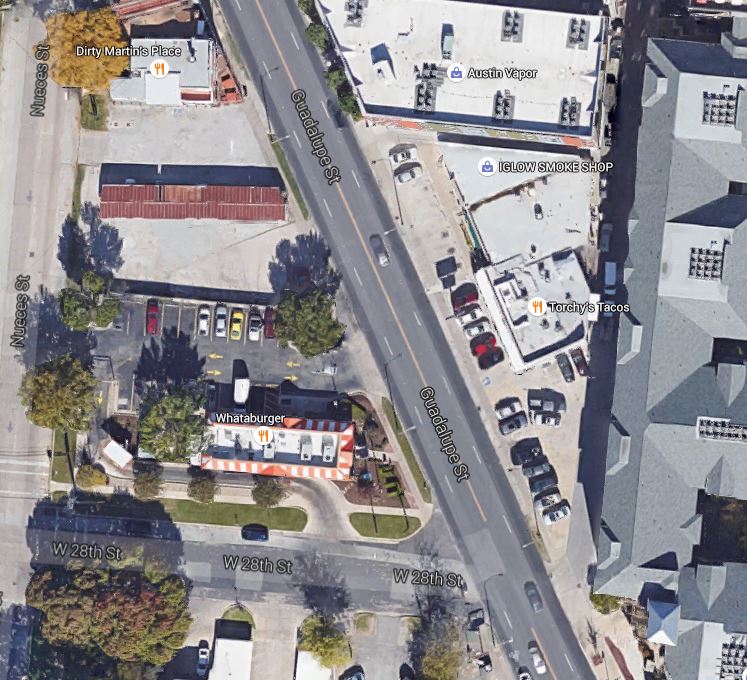
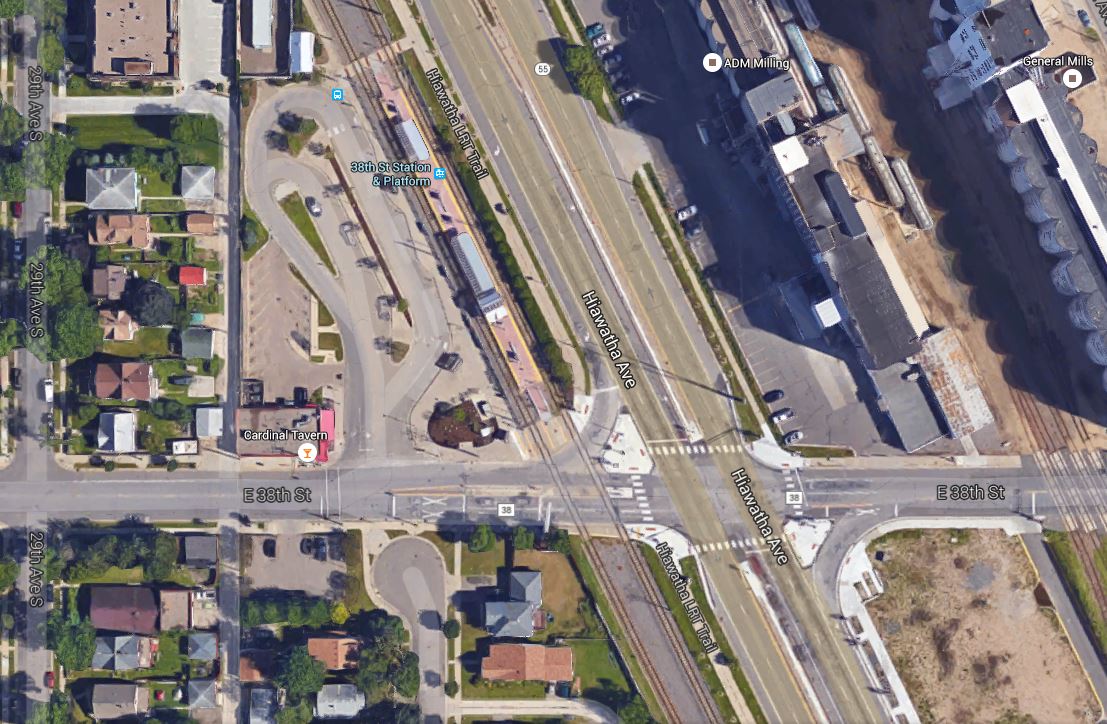
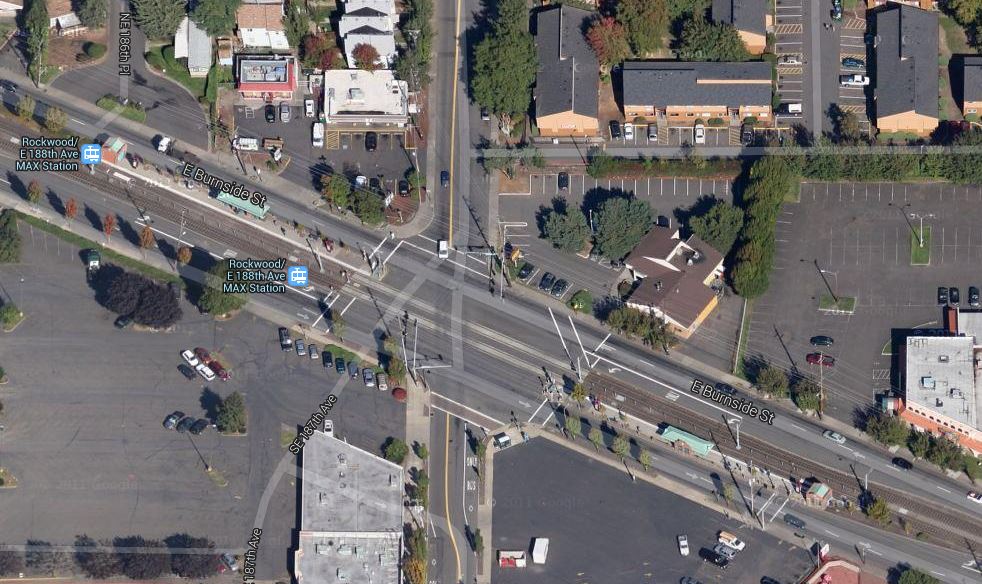
Aerial view of most constricted section of Guadalupe-Lamar corridor, between 24th-29th St. Graphic: Google Earth. (Click to enlarge.)
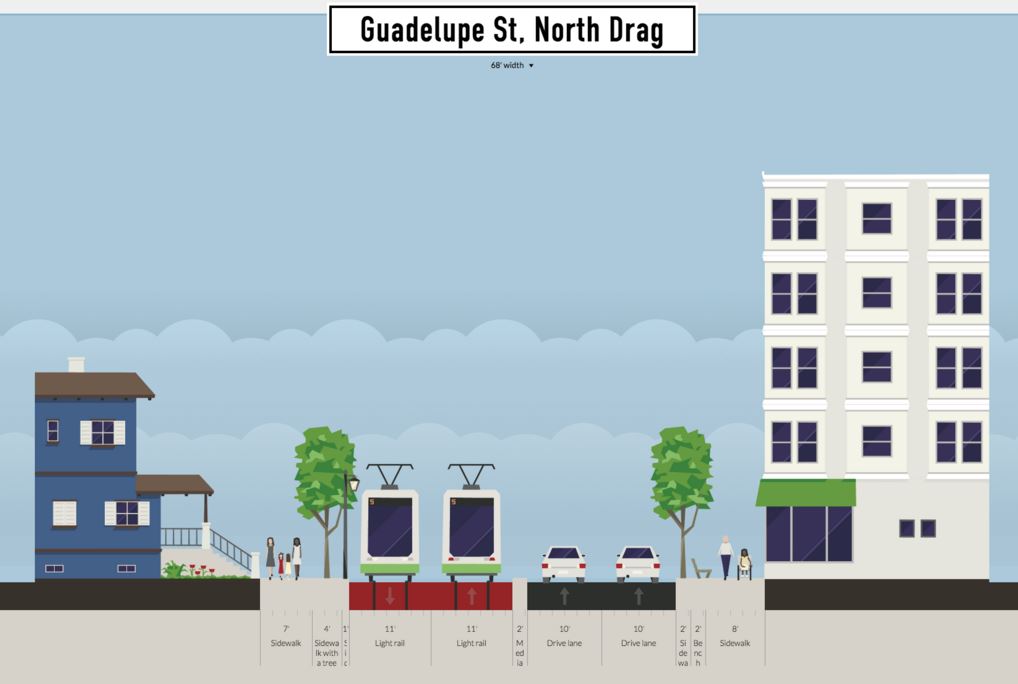
Proposed LRT alignment in narrow segment of Drag between 24th-29th St. Graphic: Andrew Mayer. (Click to enlarge.)
Central Guadalupe segment
To insert the LRT alignment in the relatively narrow segment of Guadalupe between 29th and 38th St., Andrew’s option seems to eliminate a traffic lane, although he assumes a turning lane in some cases. (With ROW assumed at 100 feet or more, Andrew’s plan would seem to require additional property acquisition in this section.)
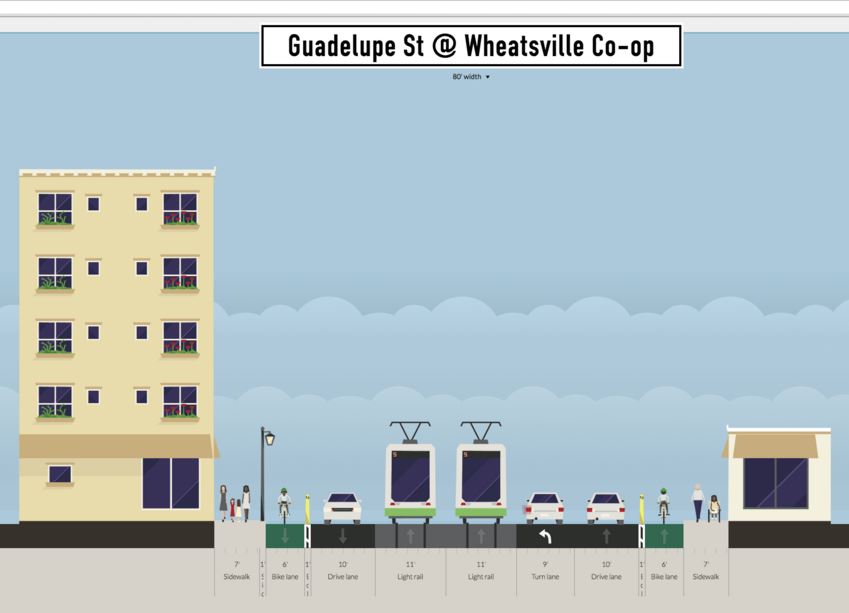
Proposed LRT alignment in narrow segment of Guadalupe between 29th-38th St. Graphic: Andrew Mayer. (Click to enlarge.)
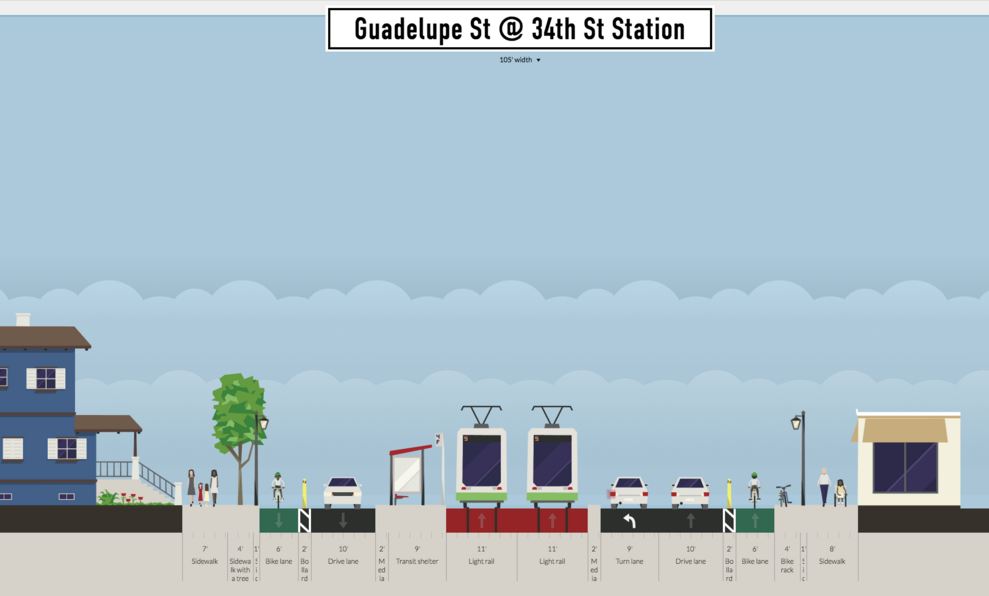
Proposed 34th St. station (platform for southbound direction shown). Graphic: Andrew Mayer. (Click to enlarge.)
At West 38th St. (shown in a Google Street View below), Andrew apparently proposes a short subway section, commenting “The transit lanes plunge beneath the street in a shallow cut-and-cover tunnel (basically an underpass) so there can be turning lanes for NB auto traffic without expanding the road’s ROW [right-of-way]….” Technically, this is possible — but quite an expensive feature, particularly since a station for this important east-west arterial would certainly be justified (and a subway station would add a considerable capital expense).
Street view of Guadalupe at 38th St. intersection. Graphic: Google Street View. (Click to enlarge.)
Our own design (which avoids any heavy civil works) assumes that LRT, like MetroRapid buses and ordinary traffic, would simply continue to operate through the W. 38th St. intersection at-grade, following the current surface street profile. Nevertheless, Andrew’s tunnel proposal indicates that there are indeed other options in the planning toolbox that could be considered to address engineering, political, or other concerns.
North of W. 38th St., for about eight blocks (to W. 45th St.) this section of Guadalupe is bordered on the east by leafy established neighborhoods such as Hancock and Hyde Park, and on the west by the publicly owned State of Texas property of the Department of Mental Health and Mental Retardation (MHMR, including the Austin State Hospital). Andrew proposes that a narrow strip of this public property be allocated for widening of the Guadalupe ROW, thus facilitating an LRT alignment: “Between 38th and 45th St, about 15 feet of feet from the [public property] is acquired to expand the ROW to 120 feet, allowing for an 2 bike lanes, 2 transit lanes, 4 auto lanes, and a parking lane or left turn lane, and 2 10 ft sidewalks.” Andrew suggests such a transfer of state land to the city would be plausible and workable “because the existing space is basically used for fields, some interior roads, and power lines, all of which can be moved/replaced relatively easily.”
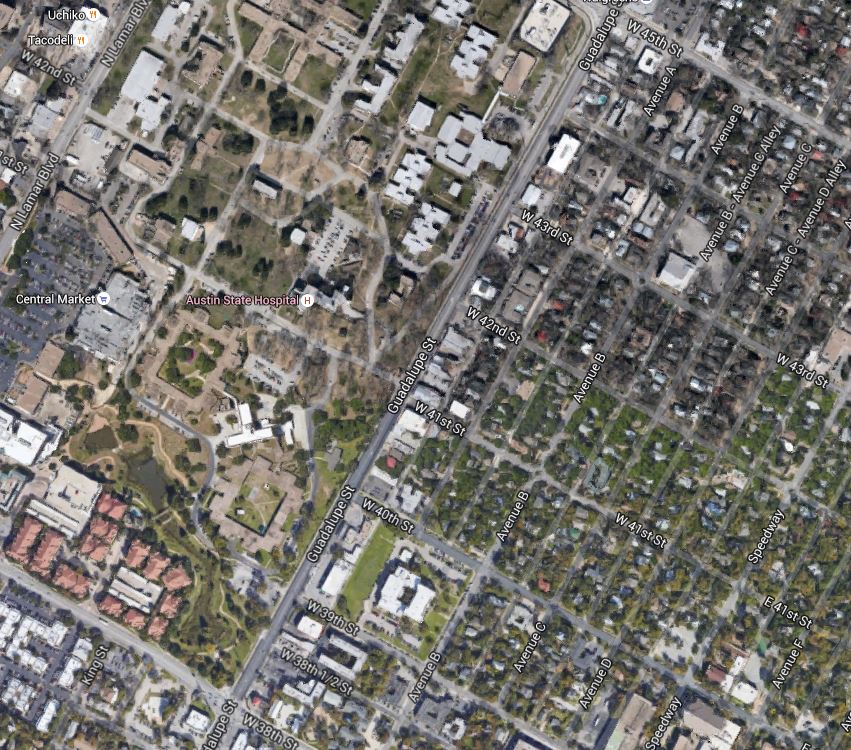
Aerial view of section of Guadalupe St. between 28th-45th St., showing MHMR bordering on west and established residential neighborhood on east side. Graphic: Google Earth. (Click to enlarge.)
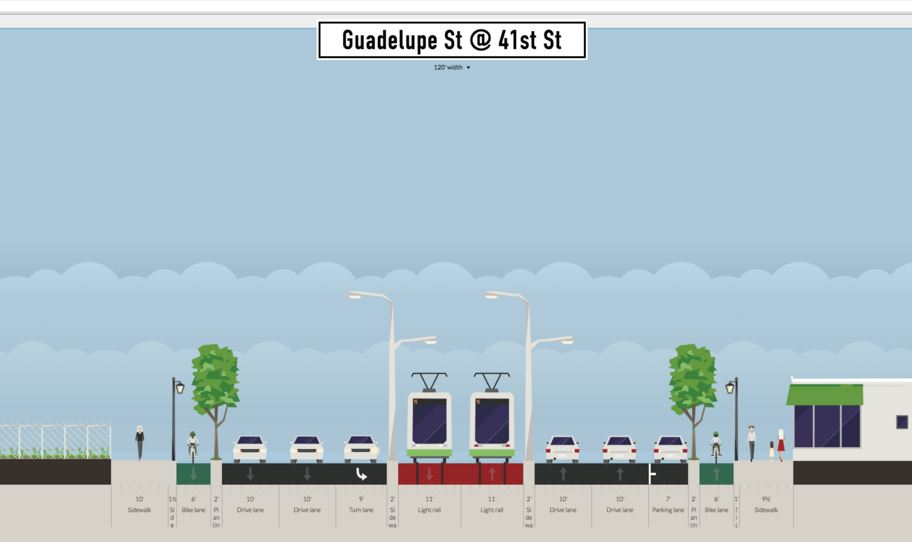
Proposed LRT alignment in segment of Guadalupe between 38th-45th St. Graphic: Andrew Mayer. (Click to enlarge.)
Use of this property in this manner as part of an LRT alignment has been proposed in various studies and propositions over the past 25 years. The day is surely coming when the State will seek to divest itself of this property, perhaps to private interests, so if an easement for ROW expansion is to be procured, official planning and action would seem urgent. Yet no public body, particularly neither Capital Metro nor the City of Austin, has taken a single official step toward this goal in all the years the idea has been on the table.
In the section north of W. 45th St. West Guadalupe St. branches off Guadalupe to connect with N. Lamar Blvd., forming the Triangle area (see map below). West Guadalupe provides a wider ROW here, and is followed by the LRT route, as shown in Andrew’s design, also below. Andrew comments that “Like in the 38th-45th portion, state land would be acquired (basically fields) to expand the roadway. In this case, the northbound auto and bike lanes would be just east of the existing oak trees next to Guadalupe.”
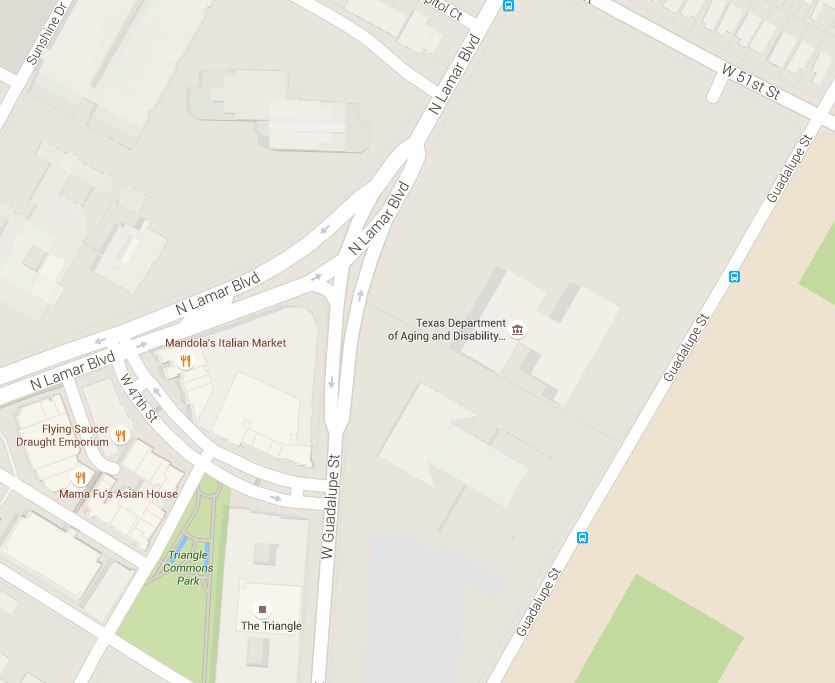
Map snippet shows West Guadalupe St. joining North Lamar at triangular land section now known as “the Triangle”. Graphic: Google Maps. (Click to enlarge.)
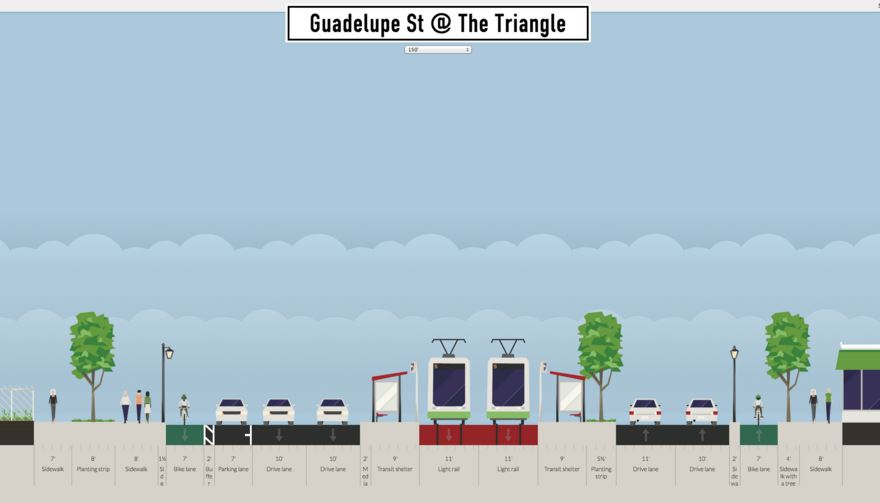
Proposed LRT alignment past Triangle, with station. Graphic: Andrew Mayer. (Click to enlarge.)
North Lamar segment
Having transitioned to North Lamar, the alignment with Andrew’s proposed design would seem to require acquisition of more ROW to accommodate a cross-section width of 115 feet for pedestrian and bike facilities, landscaping, and buffer zones (see typical cross-section, below).
As Andrew subsequently explains,
The expanded roadway would work by turning the parking spaces in front of businesses into larger sidewalks and bike lanes. Parking lanes would be put in between the auto lanes and bike lanes where possible to allow for some parking capacity. I HIGHLY recommend doing a study of the traffic going to businesses along this section of N Lamar. How many customers can access the business by foot/bike/transit? For those who have to drive, is there enough parking on the street or behind the business?
Andrew notes that “Interestingly, this section of Lamar Blvd is one of the study areas for CodeNEXT [current process revising Austin’s land-use regulations], so perhaps there is data available there.”
Andrew’s wide streetscape design (which undoubtedly would require extensive and costly adjacent property acquisition) contrasts with our own narrower design proposal which assumed insertion of LRT within existing public ROW (except at intersections with stations, where modest widening would occur). There’s no question that widening North Lamar with amenities such as Andrew has suggested would create a significantly enhanced environment for the public. The issue here is whether it should be included in the initial starter line design, or proposed as a later major upgrade to the corridor.
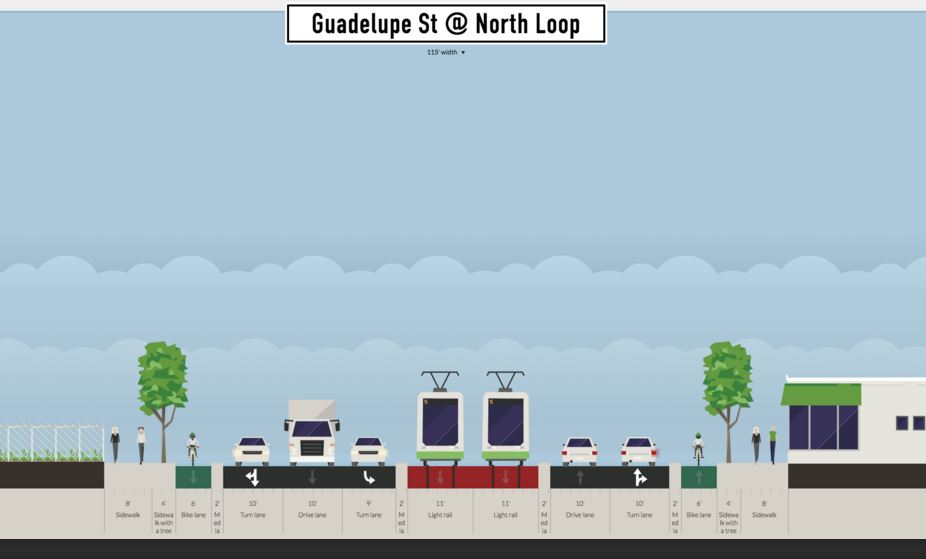
Proposed typical LRT alignment in North Lamar. Graphic: Andrew Mayer. (Click to enlarge.)
For a station at the intersection of North Lamar with the major east-west arterial Koenig Lane (shown below), Andrew remarks that “Large parking lots in the shopping center, unused TxDOT land (that was going to be used for freeway along [Koenig] Ln), and fields along the DPS building could all be acquired to make a full-sized boulevard next to [Koenig] Ln.”
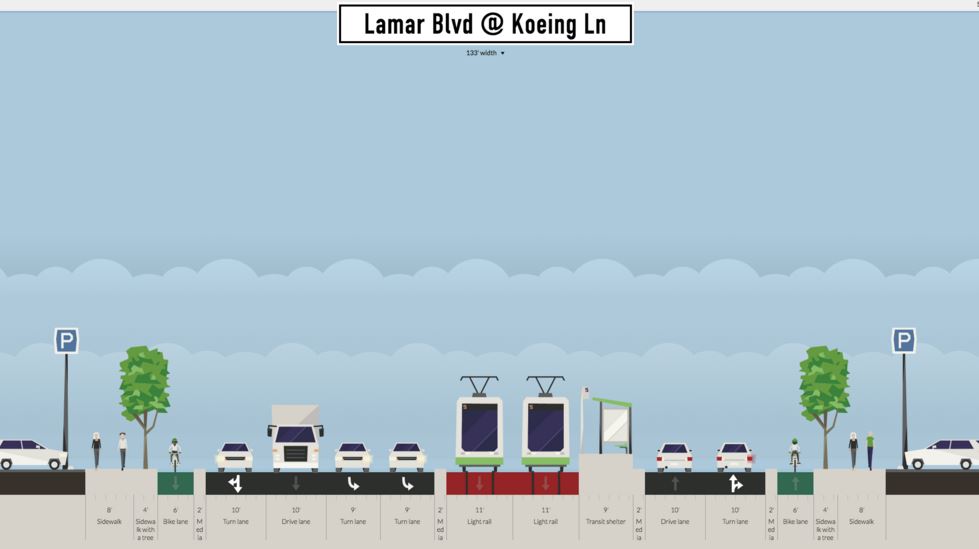
Proposed Koenig Lane station (platform for northbound direction shown). Graphic: Andrew Mayer. (Click to enlarge.)
Andrew’s designs terminate at Crestview — a major and rather complex nexus, with the heavily used Airport Blvd. intersecting and the MetroRail Red Line rail transit route crossing North Lamar, parallel to Airport (see aerial view, below). Maintaining a 115-ft ROW assumption, Andrew provides a surface LRT design, shown further below; although an interchange station would be essential here, none is presented. Calling his surface design “Alternative 1”, Andrew explains that “Transit lanes stay at grade, there are only 2 instead of 3 NB auto lanes, and the sidewalks are only 12 ft wide each.”
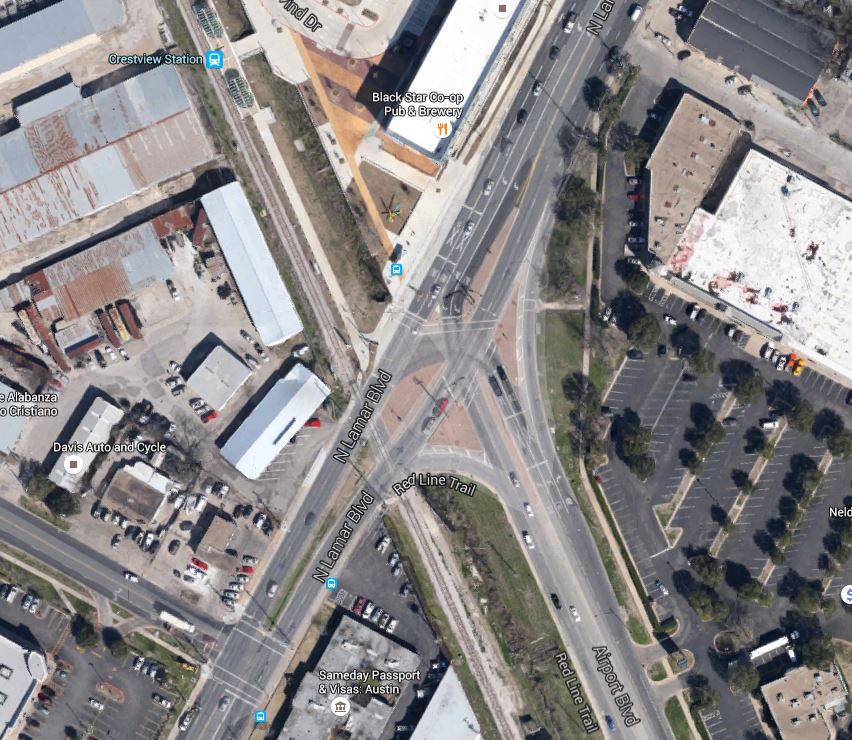
Aerial view of complex intersection of North Lamar with Airport Blvd. and Red Line alignment. Graphic: Google Earth. (Click to enlarge.)
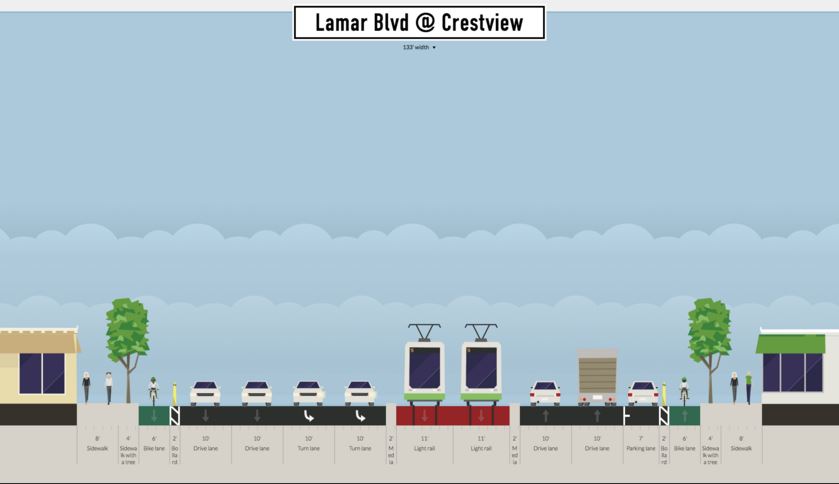
Proposed typical LRT alignment at Crestview. Graphic: Andrew Mayer. (Click to enlarge.)
Andrew also proposes an “Alternative 2” in which “Transit lanes and the station go into a cut-and-cover tunnel beneath the auto lanes.” He acknowledges that such a subway would be “More expensive and complex to construct, but retains the same number of NB auto lanes and allows for wider sidewalks and more parking.” Andrew indicates a preference for his first alternative, keeping LRT on the surface.
Austin Rail Now believes that an initial surface starter LRT line could safely and efficiently operate through the Crestview intersection as it basically exists. Ultimately, however, some method of grade separation at this complicated intersection may be prudent. We believe this should involve either tunneling or elevating (or both) the motor vehicle traffic — leaving the surface to transit, pedestrians, and bicycles. Not only is this approach more compatible with a livable, walkable environment, but it also recognizes that there is many times greater funding available, from all sources, for roadways, while transit is strapped for resources.
Summing up
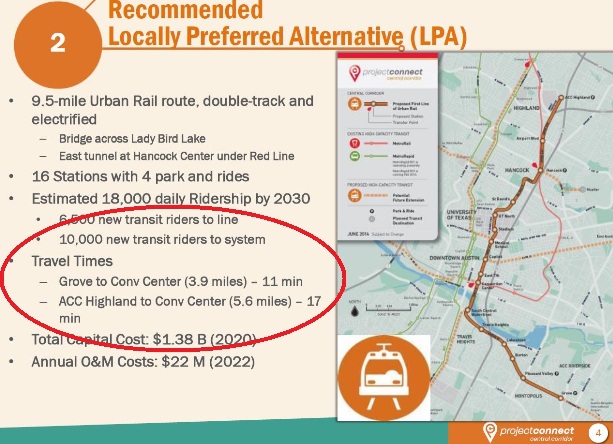
Considering both our own design proposal and Andrew Mayer’s more ambitious approach, our thoughts return to the controversy over Project Connect’s ill-fated urban rail planning process and proposal that emerged through the fall of 2013 and eventually crashed and burned in the November 2014 vote — in particular, the expressions of skepticism, utter hopelessness, deficit of vision, and outright hostile resistance voiced by several members of the Central Corridor Advisory Group (CCAG) and Austin City Council in their efforts to disparage and dismiss the possibility of installing LRT in the Guadalupe-Lamar corridor. Fortunately, that nonsense (whether based on misunderstanding, ignorance, or cynical political sniping) has mostly evaporated.
Between the two designs now already on the table, it’s possible to see that in reality a broad range of alternatives and design options is available to make this happen. It’s neither impossible nor astronomically expensive. We believe our “minimalist” design is the most immediately affordable, workable, and attractive to voters and the public at large — but that’s just our assessment; we strongly believe all options are worth considering.
It’s time to end Austin’s long saga of indecision, conflict, bumbling, bungling, and diddling. Guadalupe-Lamar is truly the city’s strongest “central corridor”, by far the most logical backbone for a light rail transit starter line. The major task at hand is mustering the community and political will to bring an LRT project here to fruition. ■