Archive for the ‘Project Connect methodology issues’ Category

h1

Project Connect’s Orange Line operating cost assumptions seem to fail plausibility test

3 December 2019

Cover of Project Connect’s O&M cost methodology and assumptions report. Screen capture by ARN.


This analysis has been adapted and revised from comments originally posted to the #ATXTransit listserv by Lyndon Henry, a technical consultant to the Light Rail Now Project and contributing editor to Austin Rail Now (ARN).

For approximately the past year, Capital Metro’s planning program, Project Connect, has been analyzing two travel corridors for major high-capacity rapid transit investment – the Orange Line (basically following the North Lamar-Guadalupe-South Congress corridor) and the Blue Line (roughly following the Red River-San Jacinto/Trinity corridor through downtown and then the Riverside corridor out to ABIA). A federally required Alternatives Analysis has been undertaken by a consulting team led by AECOM to recommend a modal system choice between light rail transit (LRT) and bus rapid transit (BRT), as well as other features and service characteristics such as vehicle types, station locations, alignments, and the capital costs and operating and maintenance (O&M) costs of each alternative.

Recently the agency released as public information selected details, including methodological procedures and cost assumptions. These have prompted scrutiny by community professionals and activists, particularly in regard to important O&M cost assumptions. In some cases these assumptions have been called into question.

For example, a 13 November posting by research analyst Julio Gonzalez Altamirano (JGA) on his Informatx.org website presented an extensive critical analysis. This resulted in two major findings:

• Project Connect’s BRT revenue hour cost estimate is lower than the national average by 26%. Project Connect does not explain its rationale for the methodological choices that lead to the lower rate.

• Project Connect’s use of a flat passenger car revenue hour rate to calculate LRT costs obfuscates the economies of scale associated with multi-car LRT trains. This is a change from the approach taken by Project Connect in 2013-2014. The new method makes Blue Line LRT appear more productive and Orange Line LRT less productive than an approach that recognizes the cost advantages of LRT scale (e.g. multi-car trains). Project Connect does not explain the rationale for the methodological switch or why its current approach will generate more accurate estimates.

These findings are broadly in line with the results of ARN’s own research into Project Connect’s O&M cost methodology and resultant assumptions, particularly with respect to the Orange Line surface LRT and BRT alternatives. Our analysis relied primarily on data for appropriate peer systems to Austin, reported in the Federal Transit Administration’s National Transit Database (NTD).

Basically, we find that Project Connect’s cost per vehicle-hour assumptions consistently seem to overestimate LRT costs by more than 51% and underestimate BRT costs by over 26%. The bottom-line result is to skew Project Connect’s O&M cost assumptions as much as 70% in favor of the BRT alternative. This produces a relatively huge disparity in evaluating the alternatives, and challenges plausibility. Details of our analysis, plus conclusions and a recommendation, are presented below.

Methodology

Operational configurations and service cycles affect O&M costs, including costs per vehicle-mile. ARN’s methodology has differed somewhat from JGA’s. Most importantly, from the 2017 NTD (latest currently available), ARN selected seven new-start LRT “peer” systems based on both urban characteristics and surface-running alignment and operational configurations that we judged to more closely match those of Austin and the proposed Orange Line surface LRT: Denver, Houston, Minneapolis, Phoenix, Portland, Sacramento, Salt Lake City. Although some have urban or suburban branches on exclusive alignments, all have significant segments in urban streets.

These seven systems have been selected in part for their urban, extensively on-surface, and in some cases predominantly street-routed character (similar to the alignment proposed for Austin’s Orange Line). Generally comparable urban population and density were also an important factor. As state capitals, Denver, Sacramento, Phoenix, Salt Lake City, and St. Paul (included in the Minneapolis-St. Paul system) also make good peer cities for Austin. Other new-start LRT systems that might have some sections on city streets but operate predominantly over extensive regional lines or grade-separated alignments were not considered as fully comparable cost models.

In contrast to our peer-systems approach, Project Connect states that, via its own methodology, “O&M unit costs for LRT service reflect a weighted national average cost per revenue hour ….” [Orange Line Operating and Maintenance Costs, 30 Oct. 2019] Apparently these costs are based on NTD data.

However, if Project Connect calculated its average from national data of all LRT systems reported in the NTD, this would have included a widely disparate collection of O&M and other data, much of it starkly dissimilar to Austin’s demographics and proposed LRT operational conditions. For example, legacy systems (remnants of historic surface electric railways dating back to the late 19th or early 20th century) such as those in Boston, San Francisco, Newark, and Pittsburgh retain a variety of older operating characteristics (e.g., onboard fare collection by train operators) that drive their vehicle-hour costs significantly higher than the average of modern new-start systems.

Other problems with such an indiscriminate approach include differences in alignment engineering configuration. Accordingly, we assessed some modern new-start LRT systems to be less suitable O&M vehicle-hour cost models for Austin’s proposed street-routed LRT Orange Line, including several we excluded particularly because of their proportionately more extensive subway and elevated segments: Buffalo, Los Angeles, St. Louis, Dallas, Seattle.

Nevertheless, despite what appear to be serious weaknesses with its own methodological assumptions, Project Connect has calculated an O&M cost per vehicle-hour of $284.15 (2017) for its Orange Line LRT surface alternative.

As regards BRT, in our judgement eight of the operational configurations of BRT systems reported in the 2017 NTD seemed to conform to the Orange Line BRT surface operating proposal, and can be assumed to represent peer systems with respect to Austin. These BRT services – operating in Cleveland, Eugene, Ft. Collins, Grand Rapids, Hartford, Kansas City, Los Angeles, and Orlando – thus provide an appropriate basis for comparing and evaluating Project Connect’s Orange Line LRT and BRT scenarios. New York City was excluded because its exceptionally high density, population size, and vast multi-model transit system are far out of proportion to Austin’s conditions. Boston’s disconnected system, partly operating as a trolleybus subway, also seemed inappropriate as a peer system. Likewise the Roaring Fork Transportation Authority’s operation, a basically rural system more closely resembling a regional or intercity motor coach service than an urban transit service, was also excluded. Data for the eight peer systems were used to develop metrics for comparison with Project Connect’s assumed cost inputs.

For 2017 O&M cost per vehicle-hour for Project Connect’s Orange Line BRT surface alternative, Project Connect’s own assumptions (based on information from CMTA and NTD) amount to an effective estimate of $119.10, as JGA has converted from Project Connect’s 2028 estimates.

To calculate current national averages and metrics for comparison, we’ve totaled current costs and other relevant values for the target LRT and BRT peer groups from National Transit Database (NTD) profile data, then calculated averages from those totals. All costs discussed are presented in 2017 dollars.

Results

LRT: Average actual 2017 O&M cost per vehicle-hour for the seven peer LRT systems is $187.52, 34.0% lower than Project Connect’s assumed cost of $284.15 for the Orange Line surface LRT option.

BRT: Average actual 2017 O&M cost per vehicle hour for the eight peer BRT systems is $162.23, 36.2% higher than Project Connect’s assumed cost estimate of $119.10 for the Orange Line surface BRT option.

LRT vehicle-costs/hour are typically higher than for buses mainly because LRT cars are larger and stations are also usually larger, creating higher maintenance costs. (These characteristics generally stem from LRT’s higher capacity and propensity to attract greater passenger volumes.) The ratio of actual NTD-reported peer-system LRT to BRT costs is 1.16. However, Project Connect’s cost assumptions amount to an LRT:BRT ratio of 2.39 – in other words, approximately twice the cost ratio in actual operating experience. The disparity between Project Connect’s estimates and costs experienced in actual operations is illustrated in the graph below.


Graphic illustration of disparity between Project Connect’s O&M unit-cost estimates and actual reality of costs experienced by actual operations of comparable peer LRT and BRT systems. Graph: ARN. (Click to enlarge.)


Conclusions and recommendation

Project Connect’s assumption for cost per vehicle-hour appears to substantially underestimate BRT and overestimate LRT – and this has dramatic consequences for the agency’s overall cost model results, seemingly skewing the evaluatory process and calling into question the plausibility and validity of the agency’s O&M cost analysis. The table below, presenting Project Connect’s comprehensive O&M cost calculations for the Orange Line alternatives, illustrates how the differential in O&M cost-per-vehicle-hour estimates translate into enormous differences of tens of millions of dollars in annual O&M cost assumptions.


Table of O&M cost calculations from Project Connect’s report. Screen capture by ARN. (Click to enlarge.)


We would strongly recommend that these assumptions and the overall O&M analysis of these alternatives be reviewed and revised – particularly by basing cost estimates on appropriate peer systems relevant to the LRT and BRT alternatives proposed by Project Connect for the Orange Line.

h1

Reorganized Project Connect 2.0 opens up, reaches out

30 April 2017

Guadalupe-Lamar corridor places at top of Project Connect’s table of corridor rankings shown in slide at April 26th MCAC meeting. Photo: L. Henry. (Click to enlarge.)

Has Austin’s public transportation planning and decisionmaking establishment turned a new leaf?

That’s yet to be fully determined. But … if Project Connect – the Capital Metro-sponsored major planning effort in charge of evaluating possible rail and other forms of “high-capacity transit” – offers any indication … there may be signs of a changed focus.

The original Project Connect earned intense distrust from Austin’s most ardent transit advocates because of its role leading the 2013-2014 High-Capacity Transit study that produced the disastrously flawed $600 million Highland-Riverside urban rail proposal (defeated by voters in November 2014). In contrast, the current planning agency (“Project Connect 2.0”) appears to have actually undergone a makeover in some important respects.

Personnel — A totally new planning team, with completely different personnel from the original Project Connect.

Consultants — A new consultant team led by AECOM.

Methodology — A focus on actual travel corridors rather than the original Project Connect study’s method of slicing up central Austin into districts and sectors and mislabeling them “corridors” and “subcorridors” … plus analytics that seem more accurate in evaluating and prioritizing corridors for a comprehensive plan.

Public involvement — What seems to be a much more sincere effort than in the past to solicit and engage actual involvement by key members of the community in the nuts and bolts of the planning process.

Included in this outreach have been strong advocates of urban rail for the Guadalupe-Lamar corridor. Invited to an April 17th consultory meeting, representatives of the Texas Association for Public Transportation (TAPT, sponsor of the Light Rail Now Project and this website) and the Central Austin Community Development Corporation (CACDC) were presented an overview of Project Connect’s planning process and its current status, which appeared to represent a new direction in goals and methodology and a somewhat new approach to public involvement.

Currently Project Connect is completing what it designates as Phase 1 of its overall analysis – concentrating mainly on evaluating and selecting corridors as candidates for possible “high-capacity transit”. Phase 2, according to the agency, about to begin, will focus on selecting modes (i.e., types of “vehicle” systems), identifying funding mechanisms, determining “the best set of solutions”, and recommending Locally Preferred Alternatives (LPAs).

At the April 17th meeting, the attendees were told that the Guadalupe-Lamar corridor was ranking quite high in the evaluation. They were encouraged to attend a public meeting of the Multimodal Community Advisory Committee (MCAC), set for April 26th, where the major results of Phase 1 would be presented.

And indeed, at the April 26th MCAC meeting, Project Connect team members, via a slide presentation led by the project’s Director of Long Range Planning Javier Argüello, revealed the study’s conclusion: Guadalupe-Lamar had emerged as the study’s top-ranked corridor. (At top of this post, see closeup of slide of ranking table.)


Project Connect’s table of corridor rankings shown in slide at April 26th MCAC meeting. Photo: L. Henry. (Click to enlarge.)


From here, according to the study timetable, the focus will narrow on possible modes (rail modes, buses, others) and comparative costs. Obviously, there’s no guarantee that light rail transit (LRT) on Guadalupe-Lamar – the center of substantial community interest for decades – will make the final cut.

Unfortunately, it’s possible that an evaluation could be impaired or skewed by false assumptions. For example: Buses in dedicated lanes may rate as a “high-capacity” mode, but they have not shown that they can attract passengers to utilize that capacity at a rate or level comparable to LRT. Also, LRT has shown a much higher propensity to attract adjacent development – particularly transit-oriented development, or TOD – than “high-capacity” bus services such as MetroRapid. And there are other significant performance and operational issues to consider.*

*See:
New light rail projects in study beat BRT
LRT or BRT? It depends on the potential of the corridor

Nevertheless, despite an array of critical differences, study methodologies and planning models frequently treat rail and bus modes as if they’re totally interchangeable in key features such as attracting ridership, accommodating future ridership growth, and stimulating economic development.

So will an adequate, fair, accurate comparison be conducted? Are local public transport planners actually starting to move in a new direction? The jury’s still out. But Austin’s staunchest transit advocates are watching … and hoping.

h1

Capital Metro: Let’s have 2 1/2 more years of analysis paralysis

27 February 2016
Title slide of Capital Metro's CCCTA presentation to Austin City Council Mobility Committee on Feb. 3rd. Screen capture: ARN.

Title slide of Capital Metro’s CCCTA presentation to Austin City Council Mobility Committee on Feb. 3rd. Screen capture: ARN.

After months of preparation, organizing, bidding, and selection, with lots of fanfare Capital Metro at last launched its $3 million, 30-month (2.5-years) Central Corridor Comprehensive Transit Analysis (CCCTA) study. In a Jan. 25th news release, Capital Metro announced that its board of directors had selected engineering firm AECOM as the lead consultant to conduct the Central Corridor analysis.

To the uninitiated, inexperienced, and uninformed, this latest study might seem some kind of step forward for Austin’s transit development. After all, its elements include impressive-sounding goals like “An in-depth study of a variety of transportation modes and their potential for creating improved transit options within the corridor”, “A multimodal transportation plan that improves the feasibility of transit in the Central Corridor while effectively maximizing connections with regional routes in surrounding communities”, and “A realistic cost analysis for building, operating and maintaining the proposed sustainable and connected transit system”.


Capital Metro's planning chief Todd Hemingson explains CCCTA study to Austin Mobility Committee on Feb. 3rd. Photo: ARN screenshot from official video.

Capital Metro’s planning chief Todd Hemingson explains CCCTA study to Austin City Council Mobility Committee on Feb. 3rd. Photo: ARN screenshot from official video.


Analysis Paralysis gold medal

But, among grassroots public transportation advocates in Austin, it’s hard to find a transit supporter who’s enthusiastic about this study. The reason: All of these issues have already been exhaustively studied, and plans prepared and re-prepared, over and over and over and over again, for more than two decades. For Austin transit supporters, we’ve “been there, done that” — multiple times. It’s just one more repetitive “re-study of the re-studies of the re-studies ….”

To get a breathtaking idea of the time, resources, energy, and money Austin has sunk into planning for “high-capacity” public transport, just check out our February 2015 chronicle of studies and re-studies of light rail transit (LRT) in the Guadalupe-Lamar corridor: «Long saga of Guadalupe-Lamar light rail planning told in maps». This central travel corridor’s high level of traffic, population and employment density, and crucial position accessing and connecting vital activity centers (like UT, the Capitol Complex, and downtown) with key established neighborhoods and extended commercial activity along the route have made it the focus of planning for rail transit for over three decades.

In terms of public transit, Austin clearly is a top contender for the Analysis Paralysis gold medal. And Capital Metro’s latest CCCTA study, as it’s currently designed, surely represents Exhibit A toward this dubious award. The confusion, misdirection, conflicting intentions, and lack of purpose underlying this “paralysis” were discussed in our March 2015 article «Austin’s urban transport planning seems struck by catastrophic case of amnesia and confusion».

Meanwhile, as meaningful public transport planning continues to languish, the Austin metro area is experiencing a veritable blitz of intensive highway development and construction, including at least three new tollways, massive projects on I-35, and assorted projects throughout the urban area. As the saying goes, “Roads get built, transit gets studied“.

Project Connect back from the dead?

But confusion and a continuation of “analysis paralysis” aren’t the only problems with the CCCTA study. As currently configured, the study seems little more than a rehash of Project Connect’s ill-fated “High-Capacity Transit Study” which elicited such intense community outrage beginning in 2013, the precursor to its ultimate resounding rejection by voters in November 2014. Indeed, the CCCTA project seems the first major effort to resuscitate Project Connect since its 2014 debacle.

Among the worst weaknesses of the Project Connect disinterment is the revival of the seriously flawed methodology of the earlier “analysis”. This includes ignoring actual, existing travel corridors — such as the pre-eminent Guadalupe-Lamar corridor — and instead mislabeling huge chunks and sectors of the city as “corridors”. (The methodology further subdivided the “Central Corridor” into “subcorridor” mini-sectors.) Thus, according to Capital Metro, per the CCCTA study, “The Central Corridor is defined as an area bordered on the south by Ben White (US-290), on the east by the Capital Metro’s Red Line, on the north by RM 2222/Koenig Lane, and on the west by MoPac Expressway, and includes downtown Austin.”

Not only is that vast glob of central Austin not a corridor, but (as in the 2013 activity) this approach slices and truncates actual travel corridors, particularly Guadalupe-Lamar, rather than analyzing them in terms of their suitability and potential for actually solving mobility problems with public transport (particularly urban rail). We analyzed the problems with this in our November 2013 article «Project Connect’s “corridor” study — without corridors!»


Infographic shows how Project Connect’s methodology segmented Guadalupe-Corridor into nonsensical pieces, and summarizes numerous other major problems. (Click to enlarge.)

Methodology of Project Connect study in 2013 labeled huge chunk of central city as a “corridor”, but severed actual intact travel corridors into meaningless pieces. Graphic: ARN. (Click to enlarge.)


Community skepticism about Capital Metro’s “corridor” methodology in the CCCTA study was illustrated as early as last September by Jace Deloney, a co-founder of the influential AURA group (involved with urban and transportation issues) and former chairman of the City’s Urban Transportation Commission and Capital Metro’s Customer Satisfaction Advisory Committee:

It’s very important that we advocate against using the previous subcorridor definitions for any future high capacity transit planning project. In my opinion, these subcorridor definitions were deliberately designed to end up with a Red River alignment recommendation.

Re-direct the CCCTA study!

Besides the exhaustive “saga” of studies of the Guadalupe-Lamar corridor detailed in the ARN article cited and linked above, Austin Rail Now and other community stakeholders have presented LRT alternative alignment and design proposals that provide more than enough basis for quickly reaching a decision for an urban rail starter line. The most recent proposals are described in several ARN articles:

Plan for galvanizing Austin’s public transport development: Light rail starter line in Guadalupe-Lamar (June 2015)

Another major Austin community recommendation for light rail transit in Guadalupe-Lamar (November 2015)

Another possible design for light rail in Guadalupe-Lamar corridor (January 2016)

So far, in the absence of any sense of direction toward a major urban rail investment, Austin’s top political and civic leadership is vulnerable to pressure by highway interests (such as TxDOT) for municipal general obligation bond funding for a heavy local investment in a massive I-35 overhaul and other huge highway projects. To this, a major rail transit starter line investment might be counter-proposed as a far more effective and desirable alternative for city bond funding.

It would definitely seem time to end Austin’s decades of “analysis paralysis” and move forward quickly toward finalizing an urban rail plan for public approval — a strategy that could be expedited by re-directing Capital Metro’s CCCTA study. There is certainly sufficient planning and design preparatory work already in place to provide the voting public a basis on which to make a decision for the Guadalupe-Lamar corridor. The AECOM consultant team (widely respected in the public transportation industry, with experience with LRT in Portland, Minneapolis, and elsewhere) could simply update and tweak the major engineering studies that have already been done (e.g., those in 1993 and 2000) for the Guadalupe-Lamar corridor.


Proposed 6.8-mile "Plan B" light rail transit line in Guadalupe-Lamar corridor would have 17 stations and connect  the North Lamar Transit Center at U.S> 183 with Crestview, the Triangle, UT and the West Campus, the Capitol Complex, the CBD, and the Seaholm-Amtrak area. It's projected to serve 3 times the ridership of the Prop. 1 Highland-Riverside rail line at slightly over half the capital cost.

Austin Rail Now proposal is one of several possible configurations already suggested for light rail starter line in Guadalupe-Lamar corridor. Graphic: ARN.


This would likely require a major intervention by Austin City Council members to request Capital Metro to negotiate with its consultant team for a modification of the CCCTA work plan — eliminating the proposed 30-month “slow track” study, and re-directing the project into planning, design, and engineering of LRT for the Guadalupe-Lamar corridor as suggested above. This would have the aim of placing a measure on the ballot for bond funding (to be kept in escrow till further planning and Preliminary Engineering/Environmental Impact Study tasks are completed). Adequate cost estimates are already on hand for such a ballot measure.

According to Surinder Marwah, the former Capital Metro Senior Planner who secured federal funding for the MetroRapid bus project, this can be “a reasonable plan if the elected officials, business leaders and major stakeholders can come to an agreement” for the general Guadalupe-Lamar alignment corridor. “AECOM can update the preliminary cost estimates quickly and perform fatal flaw analysis for the alignment corridor within few months — by mid-late August to get this into [a] November ballot measure.”

Capital Metro’s currently contrived CCCTA study seems little more than a “holding pattern” reflecting the indecisiveness and lack of will of key public officials in regard to public transport policy. Re-directing this study as proposed above would at long last move Austin’s rail public transport development into a widely supported action phase and head it expeditiously toward the mobility quantum leap Austinites have so long been denied. ■

h1

The fraudulent “study” behind the misguided Highland-Riverside urban rail plan

4 November 2014
Infographic shows how Project Connect’s methodology segmented Guadalupe-Corridor into nonsensical pieces, and summarizes numerous other major problems. (Click to enlarge.)

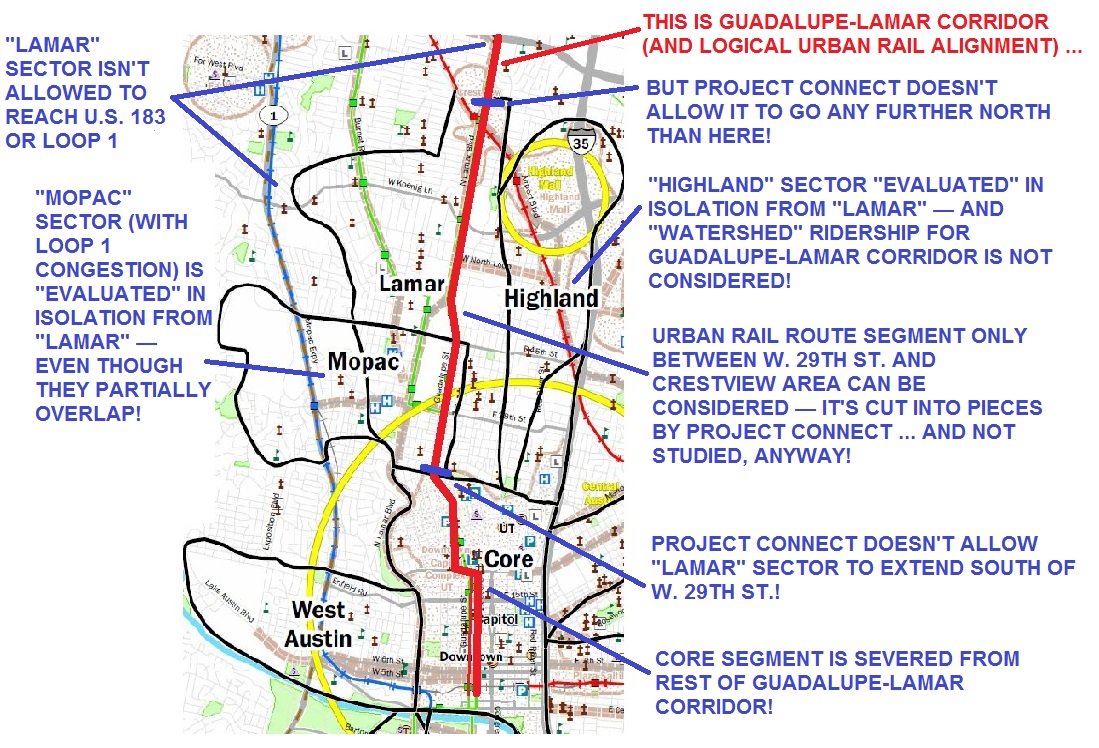
Infographic map shows several major flaws of Project Connect methodology, applied to a portion of “study” area. Result was to skew results (and urban rail route) toward desired sectors of central city. Graphic: ARN. (Click to enlarge.)

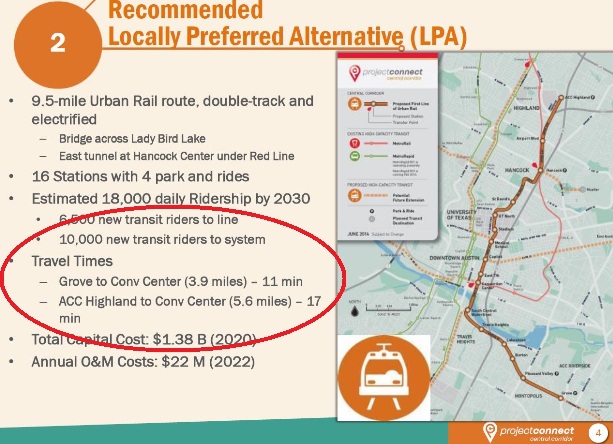
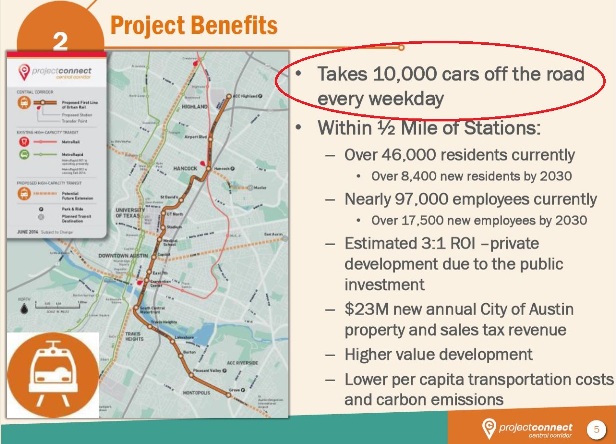
Few local issues have been more divisive than the City of Austin’s 9.5-mile, $1.4 billion urban rail plan. Envisioned for a route that meanders from the Highland ACC area on the north to the East Riverside area on the southeast, the proposal is now on the Nov. 4th ballot as a $600 million municipal General Obligation bonds measure that would help fund slightly less than half of the projected investment cost.

Community skepticism — and puzzlement — about this rail project is widespread, but sponsors and supporters of it have repeatedly endeavored to bolster its credibility by describing it as the product of a “scientific”, “data-driven”, or “data-based” effort, a “high-capacity transit study” pursued by the Project Connect transportation agency consortium roughly between June and December 2013. However, as this website and numerous other critical sources have exhaustively documented, that “study” was basically a fraud.

It’s useful to review and summarize the origins of this seriously flawed rail plan as election day has come upon us. In particular, it’s important to keep in mind that the Project Connect “study” represents an object lesson in how not to conduct a study for a New Start rail transit project. This review will rely primarily on previous articles published contemporaneously on this website during the “study” exercise.

From Mueller to Riverside to Highland

As our recent article Derailing the Mueller urban rail express — Preamble to Project Connect’s 2013 “High-Capacity Transit Study” recounted, for years, local streetcar and then “urban rail” planning had focused on a starter line to the Mueller redevelopment project. There, the major urban development enterprise Catellus had been promised a rail transit link to help raise density limits, attract more property investors and homebuyers, and thus boost profits. Important also were the desires of the small but growing community of Mueller residents who expected a rail connection to jobs and other destinations.

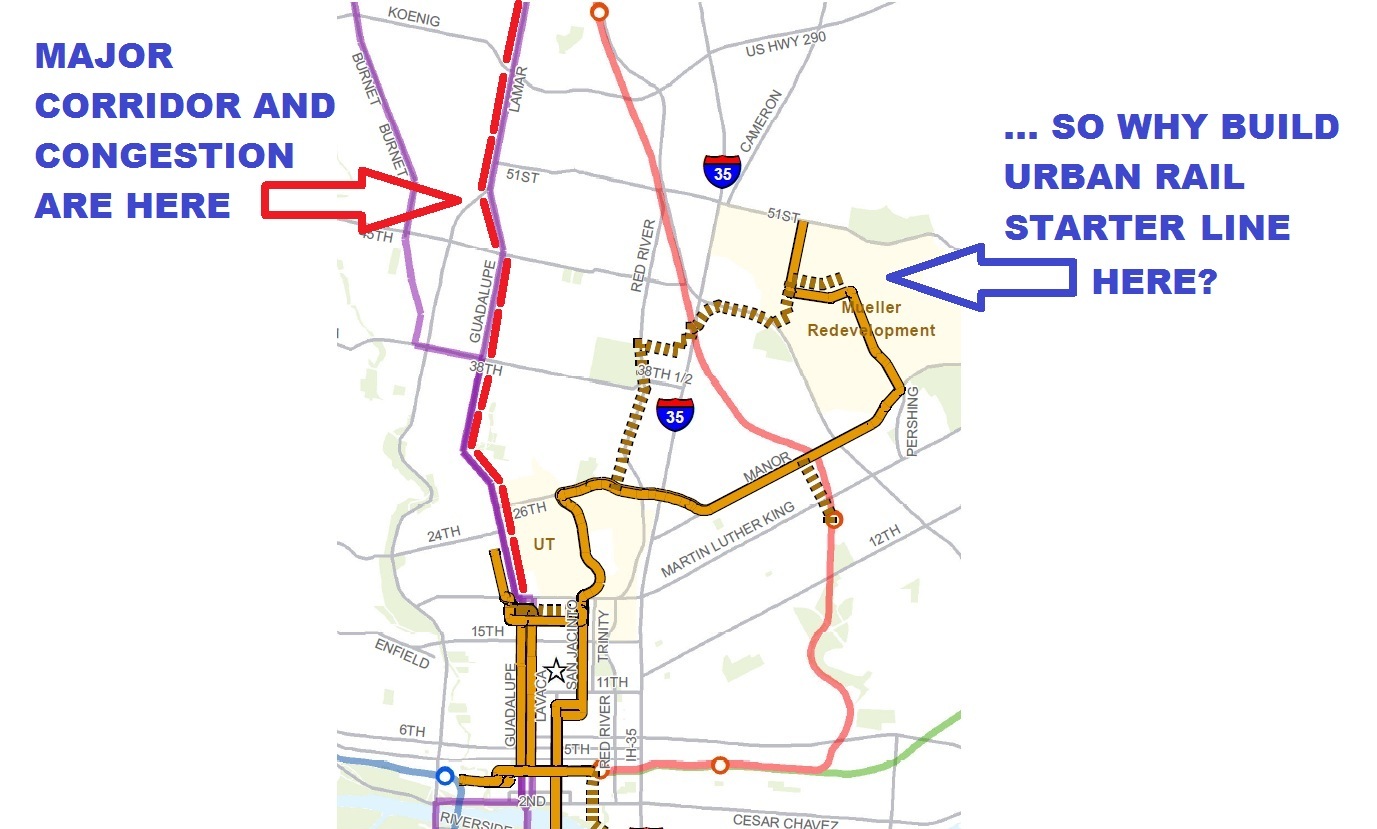
However, for years the question had been repeatedly raised: Since the North Lamar-Guadalupe corridor was recognized as the city’s heaviest local arterial corridor, with the heaviest congestion — even used to justify the very need for urban rail in official presentations and documents — why was out-of-the-way Mueller targeted for the initial starter line investment? This inconsistency was the focus of our March 2013 article Why abandon Austin’s major corridor and congestion problem? which presented the following graphic, originally contained in a 27 January 2012 commentary by Lyndon Henry (now a contributing editor to this website):


xxxxxxx

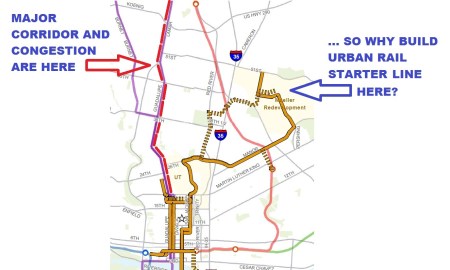
Graphic from 2012 suggested official emphasis on urban rail line to Mueller was misplaced, when real mobility need was in Guadalupe-Lamar corridor. Infographic: L. Henry.


As our “Derailing…” article, cited above, further recounts, the City of Austin/Project Connect pretext for continuing to plan an easterly, East Campus urban rail starter line to Mueller began to fall apart when the competency of a 2010 “Route Alternatives Evaluation” — the nominal basis for the plan then current — was questioned. Possibly other factors may also have begun to come into play (such as business community interest in exploring other development opportunities that could affect urban rail route planning).

In any case, the direction of rail planning shifted significantly. As our article noted,

In early 2013, Kyle Keahey was hired as Urban Rail Lead to head a new “High-Capacity Transit Study”, tasked with supposedly re-evaluating everything, racing through a process (with a presumably more competent and defensible methodology) that would result in a recommendation by the end of 2013.

Summary assessments of Project Connect “study”

Personnel associated with Austin Rail Now, the Light Rail Now Project, and other pro-rail organizations were involved intimately in following the planning activities of the “high-capacity transit” exercise from midsummer through the early winter of 2013. A number of our articles, particularly beginning in early November, chronicled revelations and realizations about the planning process as they emerged at the time.

However, a reasonable overview of the fundamental problems with the Project Connect exercise is provided in two of our articles in particular, each of them based on major commentaries by Lyndon Henry addressed to the Central Corridor Advisory Council (a group of community leaders hand-picked by Mayor Lee Leffingwell to review and approve work of the “study” team). These two articles, from early December 2013, together represent in essence an indictment of the competency and indeed the very legitimacy of the Project Connect exercise:

Memo to CCAG: “Pause” study or include “Lamar” sector

Project Connect Needs an Overhaul

What emerges is the sense of a process that was corrupted and skewed to render what, in hindsight, appears to be predetermined results — results seemingly contrived to justify a routing scheme for the proposed urban rail starter line project contrived to fulfill the aims and desires of City of Austin policy and various special interests. As our article Surprise! Mayor and Project Connect select same routes they wanted in the first place (17 November 2013) assessed the process, Project Connect’s “study” seemed to have

… numerous hallmarks of having been rigged, from a peculiarly contrived methodology that departs from longstanding professional practice, to cherry-picking of a highly questionable set of data elements and the exclusion of data indicators far more appropriate for such an ostensible “corridor study”. (And, one might add, a highly secretive and insular process that immunized the ProCon team and their study procedures from public scrutiny and oversight.)

Thus the basic flaw in ProCon’s data analysis can be boiled down to one word: GIGO (“Garbage In, Garbage Out”). In effect, this appears to have been a process that involved limiting the focus to gerrymandered data sources, and then playing games with gerrymandered data.

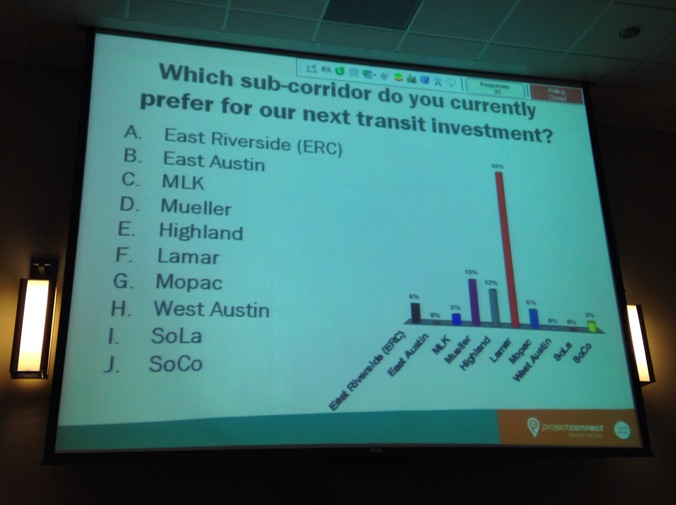
The task facing Kyle Keahey and the Project Connect team was daunting. The prevalent public sentiment strongly favored the Guadalupe-Lamar corridor for the urban rail starter line. Most Austinites sensed that Guadalupe-Lamar carried the heaviest traffic, served the highest density, and accessed the most key activity centers in the central city. Yet the City of Austin administration, Project Connect political leadership, and a major segment of local political and civic leaders desired a “study” outcome that would validate their economic and real estate development objectives. Project Connect’s effort would therefore have to try to convince the community, “Don’t believe your lying eyes.”


PowerPoint slide in Nov. 2013 Project Connect public presentation shows audience's overwhelming preference for "Lamar" — a proxy for the Guadalupe-Lamar travel corridor. Photo: Workingbird Blog.

PowerPoint slide in Nov. 2013 Project Connect public presentation shows audience’s overwhelming preference for “Lamar” — a proxy for the Guadalupe-Lamar travel corridor. Photo: Workingbird Blog.


Critical failings of the Project Connect “study” charade can be grouped into categories of practices. The following summaries of these practices include references to various ARN articles that may further illuminate these issues.

► Failure to examine travel corridors

Rather than zooming in on, and analyzing, actual travel patterns and density of travel in actual travel corridors within central Austin, the “study” instead carved out a great square of the central city, dubbed it the “Central Corridor” (although it contained multiple corridors in every direction), and then further subdivided this into a series of ten component sectors, some sprawling over considerable expanses of urban real estate. Since virtually the entire central city had been designated a “corridor”, these sectors were then dubbed “sub-corridors” — a kind of camouflage verbiage that masked the actual nature of what were in effect city neighborhoods or districts, not travel corridors. The “sub-corridor” designation also imparted a veneer of “transportation study” truthiness.

Our first analysis of this methodological problem, Project Connect’s “corridor” study — without corridors! noted that Project Connect’s subdivision of the study area in this way thus

… created an array of balkanized sectors that are analyzed more as autonomous geographic-demographic “islands” than as components essential to work together as a whole. As a result, actual, realistic, workable travel corridors have been obscured by all this.

Our article included a detailed explanation, with examples, of what urban travel corridors actually are, and how they should be treated and evaluated in a bona fide transportation corridor study. But, rather than corridors, Project Connect’s sectors (“sub-corridors”), we pointed out at the time, “resemble, to some extent, rather large travel analysis zones (TAZs, also called traffic analysis zones or transportation analysis zones).”

But, rather than TAZs for legitimate analysis purposes, we pointed out,

Project Connect’s sectors, in contrast, seem more designed to pit one part of the city against another — to function more as neighborhood enclaves to be assessed for their isolated demographics and “level of misery” (poverty, congestion, etc.) in a competitive showdown within a game of “Which sector deserves the urban rail prize?” It’s astounding that this charade is presented as a form of officially sponsored urban transportation planning.

Together with the agency team’s “seemingly heedless” segmentation of travel routes, their “treatment of adjacent sectors as insular, isolated enclaves, whose demographics and other characteristics apply only to themselves” was equally harmful to proper analysis. “Likewise travel characteristics are treated in isolation, as if the population in all these different ‘enclaves’ confine themselves to the sector boundaries that ProCon planners have established for them.”

Throughout the “study” process, we repeatedly returned to this problem. Our article Questions for Project Connect (3 December 2013), publishing questions which we raised in a “data dig” with Project Connect team members, asked “Why has this study avoided performing an actual corridor study, and instead spent its time (and taxpayers’ dollars) confined to undertaking a de facto inventory (and ‘beauty contest’) of various urban sectors in isolation?”

In our Memo to CCAG: “Pause” study or include “Lamar” sector (5 December 2013) we noted that “The basic methodology of focusing on sectors (so-called ‘sub-corridors’) meant that the study failed to study a single actual potential travel corridor in the study area.”

► Gerrymandered “study” sectors

Our Project Connect’s “corridor” study — without corridors! article, pointing out the peculiar boundaries applied to Project Connect’s weirdly sprawling sectors, described them as “gerrymandered”, and further experience confirmed this assessment. Our 17 November 2013 article Surprise! Mayor and Project Connect select same routes they wanted in the first place observed that

rather than performing a bona fide study of actual alternative corridors, ProCon embarked on what amounted to an inventory of highly filtered attributes of basically gerrymandered sectors, dubbed “sub-corridors”, devolving into a kind of “beauty contest” among sectors of the city, while distorting as well as ignoring the actual travel corridors that should have been the focus.

The article provides the example of the highly contrived “Highland” sector:

It should be noted that the “Highland” sector bears very little resemblance to the actual Highland neighborhood, delineated by both the Highland Neighborhood Association (see Highland Neighborhood Association endorses Guadalupe-Lamar for urban rail) and the Highland Neighborhood Planning Area defined by the City of Austin (COA). While the actual Highland neighborhood and planning district includes North Lamar Blvd. (mostly as its western boundary) all the way from Denson Drive to U.S. 183, ProCon’s “Highland” sector studiously avoids Lamar, and never reaches U.S. 183; instead, the sector incorporates I-35 (never even touched by the real Highland), and droops down far south of the actual neighborhood to include Hancock Center and the northern edge of the UT campus — thus overlapping the long-proposed Mueller route for urban rail. In this sense, “Highland” appears to be manipulated here as a kind of “proxy” for the COA’s original plan, functioning as a precursor of a full route to Mueller.

► Severed and segmented travel corridors

This was perhaps the single most serious fault of the Project Connect exercise — not only failing to examine actual corridor travel patterns, but essentially destroying intact corridors, such as Guadalupe-Lamar, simply because they crossed boundaries of the arbitrary sectors. As we first noted in Project Connect’s “corridor” study — without corridors!

Perhaps the most serious flaw in ProCon’s urban rail study methodology — actually, catastrophic, because it fundamentally impairs the integrity of the whole process — is that the actual travel corridors are not only basically ignored as workable corridors, but also are truncated and segmented by ProCon’s arbitrary slicing up of the urban area.

If you’re evaluating a travel corridor, you must evaluate the corridor as a whole — what it connects from, to, and in between; what the populations and densities along the corridor are; what activity centers it connects; and so on. All those are important, because they’re critical to what makes a transit line in that corridor actually feasible and worth investing in.

The results for the Guadalupe-Lamar travel corridor were basically fatal, as we pointed out:

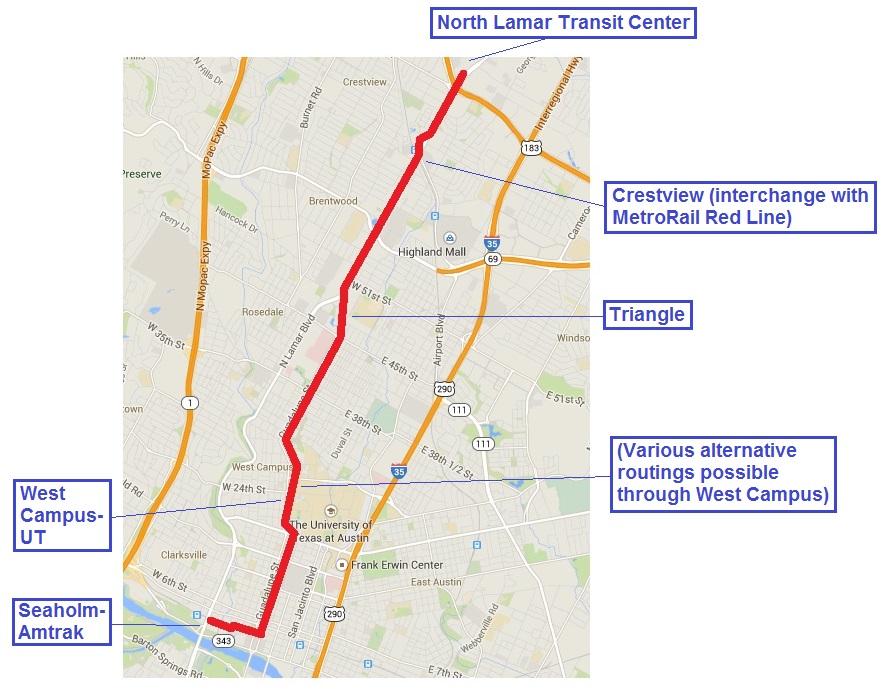
the Guadalupe-Lamar route is severed just north of the UT-West Campus area at W. 29th St. In other words, most of this potential route is cut off from its highest-density population district as well as its most productive destinations in the core of the city!

What’s left is a “rump” route, from a few blocks south of U.S. 183 to W. 29th St., that seems to have little purpose beyond perhaps some kind of “shuttle” along this isolated route segment. If there were a prize for idiotic public transport planning, surely Project Connect would be very high on the candidate list.

This problem also was repeatedly underscored. In our article Memo to CCAG: “Pause” study or include “Lamar” sector (5 December 2013) we warned that “The basic methodology of focusing on sectors (so-called ‘sub-corridors’) meant that the study failed to study a single actual potential travel corridor in the study area”, and added:

This methodology also segmented an otherwise viable corridor such as Guadalupe-Lamar into nonsensical pieces, severing the corridor from its most logical destination (West Campus and core area), and thus creating an arbitrary “rump” route (29th St. to south of U.S. 183) that goes from nowhere to nowhere.

Likewise, in Project Connect Needs an Overhaul (7 December 2013), we reiterated: “Project Connect’s methodology segmented the outstanding Guadalupe-Lamar corridor into nonsensical pieces, severing it from its most logical destination (the West Campus and core area), thus creating an arbitrary ‘rump’ route that goes from nowhere to nowhere.” These warnings, of course, were ignored.

► Excluding student and other nonwork travel patterns

While specific travel corridor trips were not examined in the “study”, Project Connect did include tabulations of total travel in each sector and estimates of trips between sectors and the Core Area. However, a particularly breathtaking aspect of the project’s Evaluation Matrix (also called the Comparison Matrix) was the exclusion of all trips except home-based work trips. In other words, non-work trips — including student trips — were omitted from consideration.

As we asked in our “data dig” Questions for Project Connect, “Why has this study’s assessment of “travel demand” from each sector to the core ignored home-based non-work (HBNW) trips — including UT student trips and recreational trips — in a college city with the largest university in Texas in its core area?”

This omission was repeatedly emphasized in subsequent articles. In our Memo to CCAG: “Pause” study or include “Lamar” sector, we pointed out:

As a measure of “Travel Demand” from each sector to the core, non-work trips such as UT student trips and recreational trips (e.g., to restaurants, bars, etc.) have been EXCLUDED — dismissing not only the enormous importance of non-work trips (which are heavy in the off-peak) for more cost-effective transit service, but especially the huge significance of student and recreational trips in a city with the largest university in the state (and located in its core).


Student travel was omitted from Project Connect's evaluation process, although their ultimately recommended route connected UT, the state's largest university, with ACC, the city's major community college. Photo via UTRugby.com.

Student travel was omitted from Project Connect’s evaluation process, although their ultimately recommended route connected UT, the state’s largest university, with ACC, the city’s major community college. Photo via UTRugby.com.


And similarly, in Project Connect Needs an Overhaul, we asked:

Extremely important non-work trips such as UT student trips and recreational trips have been EXCLUDED as a measure of “Travel Demand” from each sector to the core. How could they do this in a city whose core contains the largest university in the state?

In hindsight, the omission of student travel from the Evaluation Matrix is especially ironic in light of the fact that travel between UT and ACC would ultimately be a major component of the purported ridership of the final route presented by Project Connect.

► Manipulation of implausible projections

Skepticism about Project Connect’s heavy reliance on dubious projections began to emerge as the pace quickened toward a “recommendation” from the project team. In our 3 December 2013 article related to the “data dig”, Questions for Project Connect, we asked: “Why has this study used such speculative projections based on procedures that maximize all possible development for targeted areas (such as ‘ERC’, ‘Mueller’, and ‘Highland’), rather than using conservative projections based on conditions closer to reality?”

Local researchers and analysts such as software developer and research analyst Dan Keshet and management consultant Julio Gonzalez Altamirano had exposed serious weaknesses in the array of data projections being deployed by the project team — especially the conversion of what were in effect development “wish lists” into hard projections of future development, population, and employment that were being plugged into Project Connect’s model (an Excel-based “Evaluation Matrix” designed to competitively score the various sectors and render a winner). Their conclusions and other problems of the project’s data projections are discussed in our article What’s with Project Connect’s “2.9 million daily ridership” projection? (16 December 2013). As this article noted,

The question of projections has been an extremely contentious issue in Project Connect’s urban rail “study”. For many critics, the agency’s “projections” have represented de facto fantasies about what they would like to see, rather than the solidly reliable output of competent predictive analytics.

While projections were critical in any process of forecasting future developments and especially public transit ridership, we explained, “…there’s a vast distinction between developing conservative, reliable, and plausible forecasts, and producing exaggerated, fantasy-like projections, as Project Connect has done, heavily skewed toward certain geographical areas.”


Many of Project Connect's "data projections" for 2030 were based on "wish lists" of development, population, employment, and other demographic features — leading critics to ridicule them as "fantasy". Graphic via ARN.

Many of Project Connect’s “data projections” for 2030 were based on “wish lists” of development, population, employment, and other demographic features — leading critics to ridicule them as “fantasy”. Graphic via ARN.


In the 17 November 2013 article Surprise! Mayor and Project Connect select same routes they wanted in the first place, we expressed skepticism about “the selection of a predominantly questionable array of data elements as the basis for ‘evaluation’ of the various sectors. Leaving their ‘weighting’ aside, in the aggregate the evaluatory elements themselves are inappropriate.”

As the article explained,

ProCon relies very heavily on projections of future conditions for their basic measures. As the rail advocacy group AURA (Austinites for Urban Rail Action) has explained in its evaluation guide, projections themselves are basically unreliable, risky, flaky, whereas, in contrast, “We believe use of the real-world, recently-observed data gives the more accurate and reliable picture of potential ridership, as well as the greatest viability for federal funding.”

… Beyond a roughly five-year horizon, projections for specific neighborhoods and similar chunks of real estate basically become unreliably speculative — which seems to be what we’ve actually been dealing with … a significant dollop of real estate speculation, given a kind of veneer of “techiness” by CAMPO and their land use/travel demand model package.

For decades, public transportation advocates have warned repeatedly about the “self-fulfilling prophecy” syndrome in this kind of transportation planning process. In the past, it’s been applied mainly to highway development — justifying “future growth” in just the right places where developers want to build, so as to rationalize huge investments in new freeways and other roads. And, lo and behold, these very projections somehow materialize after the transportation facilities are built, thus “proving” the “validity” of the projections!

Today, in Austin, this process may be at work justifying speculative land development in certain areas of the central city (i.e., the central study area — “Central Corridor”), this time with the added drawback of ignoring or dismissing opportunities for redevelopment of areas in the heart of the core city, particularly centered along the Guadalupe-Lamar corridor.

As an example, in our article “Highland” sector favored by Project Connect — but where’s the travel demand? (19 November 2013) we noted that Project Connect’s presentation of CAMPO travel demand data in their own Map Book contradicted the claims of high travel demand in the “Highland” sector — one of the key underpinnings for their “recommendation” of a route to serve this fabricated sector. Thus, we warned, “since Project Connect based its assessment significantly on this data, the results presented, and the contrary evidence of very strong travel demand in the Guadalupe-Lamar corridor, contradicting Project Connect’s own stated conclusions, should at the very least raise questions about the competency and integrity of the study process.”

As we summarized the pattern in What’s with Project Connect’s “2.9 million daily ridership” projection?

Another way of saying this is that Project Connect’s planners have converted their own wishful thinking into actual data inputs, that are then deployed to make their evaluation. Wishes are used to try to make the wishes come true.

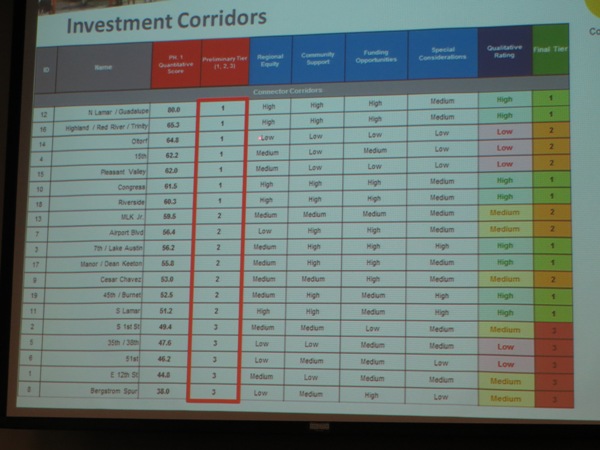
► Applying subjectively derived scores

Despite the characterization by supporters that Project Connect’s efforts were thoroughly “data-driven” and “scientific”, some components of their “study” were not even camouflaged as “projections” or externally derived data, but instead were presented merely as subjective judgements of the project team. In our 3 December 2013 “data dig” Questions for Project Connect, we asked

Project Connect’s “Physical Constraints” metric appears to be based on totally subjective value assessments, and no information has been given as to how these value judgements have been developed. Where’s the factual basis for this?

The response was that these scores were based purely on the team’s “professional judgement”. We highlighted this on our article Memo to CCAG: “Pause” study or include “Lamar” sector:

The study has assigned an extremely high “Constrained Right-of-Way” penalty to the “Lamar” sector, but not to the “Highland”, “Mueller”, “ERC” sectors — apparently implying that Project Connect considers there to be no “Constrained Right-of-Way” problems for “Highland”, “Mueller”, and “ERC”. This also is implausible, and this penalty seems to be arbitrarily applied to sectors (“sub-corridors”) that the Project Connect team dislikes (e.g., “Lamar”), but withheld from sectors they seem to prefer (e.g., “ERC”, “Highland”, “Mueller”).

► Selective manipulation of data

Another practice skewing Project Connect’s “study” results was their “cherry-picking” of data categories and their selective manipulation of their own methodology — pre-eminently, the Transit Orientation Index model they appropriated from Portland. As we explained in our analysis What’s with Project Connect’s “2.9 million daily ridership” projection? (16 December 2013):

Apparently in an attempt at a gesture toward some kind of prediction of future transit ridership, one of the metrics Project Connect decided to use in their Comparison Matrix is a “Transit Orientation Index” (TOI), a ridership demand assessment model developed in 1997 by consultants for Portland, Oregon’s TriMet transit agency. …

According to the documentation, the TOI metric is envisioned to assess transit ridership demand at the level of a small analysis zone …. Project Connect planners, however, have applied the model to considerably larger sectors covering several square miles with hundreds and even thousands of acres.

We’d previously summarized the astounding problem with the TOI model in our Memo to CCAG: “Pause” study or include “Lamar” sector, which warned that, when key projections, already embedded in the Evaluation Matrix, were plugged into the TOI,

… the results are extremely implausible — e.g., for the “ERC” (East Riverside) sector, Project Connect calculates high total daily transit ridership of 2.9 million, about equal to the total citywide daily ridership of Chicago and Philadelphia combined. (Their “low estimate” for that single sector is higher than the total citywide ridership of entire cities like Denver and Seattle.) This strongly tends to corroborate other evidence that Project Connect’s projections have been seriously exaggerated and are utterly implausible.

Likewise, in Project Connect Needs an Overhaul we observed:

Rather than developing conservative, reliable, and plausible forecasts, Project Connect has produced exaggerated, highly questionable projections, heavily skewed toward certain geographical areas. When these same projections are plugged into Project Connect’s own Transit Orientation Index (TOI), the results are ridiculously unbelievable. For the single “ERC” sector, the low-end prediction of daily transit ridership is higher than the total system daily ridership of entire cities like Denver and Seattle. On the high end, it’s about equal to the total system daily ridership of Chicago and Philadelphia combined.

These implausible outputs from the TOI were jaw-dropping. When the projections of Year-2030 population, employment, and other data items that were mainstays of their Evaluation Matrix were fed into the model, even the low-end results were absurd. For the “ERC” (East Riverside) sector, for example, as we pointed out in our What’s with Project Connect’s “2.9 million daily ridership” projection? analysis, “… the low-end figure — daily ridership of 492,682 (493K) — is equally preposterous, exceeding the total system daily ridership of entire large cities.” These cities included Portland, Seattle, Denver, and Atlanta.

As for the Highland sector, TOI results were likewise other-worldly. As we noted,

…the TOI model results for 2030 are similarly off the scale. Whereas current 2013 ridership is about 5K (5100/day), the “low” TOI prediction for 2030 is about 127K — an increase of 2,440%. The “high” prediction (no need for upper-bound substitution in this case) is 279K — a predicted increase of 5,480%.

Put another way, to meet the lower-end ridership suggested by the demographic and economic projections, average daily ridership in the “Highland” sector would have to exhibit sustained average daily ridership growth of about 7,200 each year for 17 years.

Curiously, while the project team excluded such embarrassing outputs from the TOI model from their matrix, they were selectively using other aspects of the TOI as inputs for the same matrix. As we noted,

… Project Connect’s matrix does use the TOI, itself based on the same dubious projection inputs, to render a metric score to bolster their preferred sectors (“sub-corridors”) in the competition they’ve set up. …

But, even more importantly, the TOI for 2030, dependent as it is upon Project Connect’s “projections” (de facto fantasies), exposes their absurdity. No wonder Project Connect and its entourage don’t want these used … no wonder they attempt to distance themselves from them!

It’s very simple — plug Project Connect’s own projections into this otherwise fairly realistic model, and you get bizarrely, unbelievably exaggerated results. Maybe a hint that the original projections are bizarrely unbelievable?

In effect, the TOI is performing here somewhat like a “canary in the coalmine” — telling Project Connect, and all of us, that something is terribly wrong with their demographic and economic projections for 2030.

Big Picture: Fraud

The impact of all these seemingly disconnected errors, missteps, omissions, and methodological shenanigans on a single portion of the “study” area is illustrated by the infographic at the top of this post, which focuses on several of the sectors surrounding the Guadalupe-Lamar travel corridor. (The so-called “Lamar” sector was widely misinterpreted as this corridor itself, but it was actually just a wide swath of urban real estate, stretching as far west as Shoal Creek Blvd., and embracing Burnet Road to the west as well as a segment of Guadalupe-Lamar in its eastern half — and neither of these two major travel corridors was examined.) As this graphic makes clear, the ground rules and methodology of Project Connect’s “study” very effectively prevented meaningful evaluation of this key, heavily traveled, central corridor.

From this grab-bag of colossal problems, your first assessment might be that Project Connect’s team was the rail planning equivalent of The Gang That Couldn’t Shoot Straight. Unfortunately, it’s worse. What actually emerges out of all this, from the vantage point of a year of hindsight, is a much more troubling image than mere ineptitude — by connecting the dots, the outline of a deliberate effort to deceive and to manipulate the “study” becomes unmistakable.


Kyle Keahey promoting "high-capacity transit" route selected by Project Connect, Nov. 2013. Photo: YouTube screengrab.

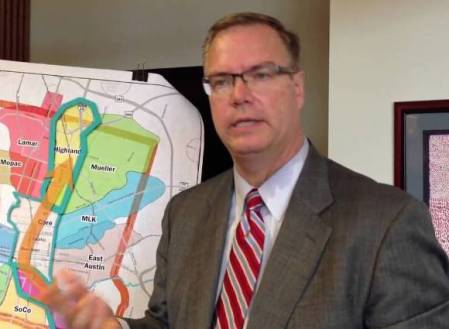
Project Connect Urban Rail Lead Kyle Keahey presenting “recommendation” of Highland-Riverside urban rail route, Nov. 2013. Photo: YouTube screengrab.


Contradictory as it might seem, it’s entirely plausible that otherwise technically competent members of the Project Connect team, drawn into the “trees” of the exercise, were unaware of the implications of the larger “forest”. Also the mind, with its ability to rationalize, justify, and alibi, can be a very mysterious apparatus.

In any case, the motives for tailoring the proposed urban rail route to the needs of development policies and interests are also very clear. These are described particularly in three of our articles:

Who are those guys? Real estate development interests and Austin’s urban rail boondoggle

UT should pay for East Campus urban rail — not Austin taxpayers

Derailing the Mueller urban rail express — Preamble to Project Connect’s 2013 “High-Capacity Transit Study”

So there’s motivation. There’s an amazing assortment of jaw-dropping methodological botch-ups. And it all fits together to promote the desires of the sponsors of the exercise.

The Big Picture we see of this whole process is dominated by a bright red fluorescent flashing sign. The sign says: Fraud. This is definitely a model of rail planning for other communities — a model to avoid at all costs. ■

h1

Reality Check: How plausible are Project Connect’s time/speed claims for Highland-Riverside urban rail plan?

24 August 2014
LEFT: Phoenix's Metro LRT — similar to Project Connect's proposed Highland-Riverside line — runs almost entirely in street and arterial alignments, with maximum speed limits, traffic signal interruptions, and sharp turning movements that slow running speed. Average schedule speed: 18.0 mph. (Photo: OldTrails.com)  RIGHT: Charlotte's Lynx LRT runs entirely in an exclusive alignment following a former railway right-of-way. Average schedule speed: 23.0 mph. (Photo: RailFanGuides.us)

LEFT: Phoenix’s Metro LRT — similar to Project Connect’s proposed Highland-Riverside line — runs almost entirely in street and arterial alignments, with maximum speed limits, traffic signal interruptions, and sharp turning movements that slow running speed. Average schedule speed: 18.0 mph. (Photo: OldTrails.com) RIGHT: Charlotte’s Lynx LRT runs entirely in an exclusive alignment following a former railway right-of-way. Average schedule speed: 23.0 mph. (Photo: RailFanGuides.us)

In a Blitzkrieg of promotional presentations over the past several months, Project Connect leaders and team members have been touting ambitious travel time and average speed projections for their urban rail project proposed to connect the Highland ACC site with the East Riverside development area. In various presentations, the agency’s Urban Rail Lead, Kyle Keahey, has claimed that the line would provide an average speed of “21 to 22 miles per hour” (impressive, compared to an average of about 25 mph for motor vehicles in urban traffic, and typical local bus transit averages of about 12 mph generally and 4-8 mph running through a in a CBD).

In terms of travel time on Project Connect’s proposed line, the agency has detailed the following:

• From the East Riverside terminus at Grove to the Convention Center downtown (3.9 miles) — 11 minutes

• From the Convention Center to the ACC Highland campus (5.6 miles) — 17 minutes


Screenshot from Project Connect's June 23rd presentation to Capital Metro board, showing travel time claims for proposed urban rail project.

Screenshot from Project Connect’s June 23rd presentation to Capital Metro board, showing travel time claims for proposed urban rail project. (Click to enlarge.)


However, several anomalies immediately leap out to experienced public transit analysts. First, the distance and time projections provided by the agency — totaling 9.5 miles in 28 minutes — imply an average speed of 20.4 mph, not the “21-22” claimed by Kyle Keahey and other representatives. Second, even an average speed of 20.4 for this type of light rail transit (LRT) service in this kind of application raises professional eyebrows (and considerable skepticism) — mainly because it’s significantly higher than what is commonly characteristic of peer systems.

Light rail transit planners commonly know that lines routes in street and arterial alignments, even reservations, face substantially more constraints to speed than do systems routed in exclusive, private right-of-way (ROW) alignments such as railway corridors, tunnels, viaducts, etc. (This is illustrated in the photo composite at the top of this post.) Some major constraints include: maximum speed limited to traffic maximum speed; operation constrained by traffic signals and cross-traffic; sharper curves and turning movements as route follows street grid. Compared with routes in exclusive alignments, the differentials usually aren’t tremendous, but enough to make a difference in schedule speeds, travel times, and other performance factors.

To illustrate this, and perform a rough comparative analysis, we’ve compiled average speeds from two sources. The first is a comparison on the Light Rail Now website, in an article titled Light Rail Schedule Speed – Faster Than Bus, Competitive With Car, with speeds summarized in the following table:


Table of LRT average schedule speeds from Light Rail Now website.

Table of LRT average schedule speeds from Light Rail Now website.


The second source is a recent compilation by Light Rail Now publisher Dave Dobbs, summarized with route lengths, average stop spacing, travel times, and average speeds, in the table below:


Table of LRT average schedule speeds and other data compiled by Dave Dobbs.

Table of LRT average schedule speeds and other data compiled by Dave Dobbs. (Click to enlarge.)


Dave notes that he included the lines he did “because they were examples from Project Connect slides.” He also points out that Project Connect’s East Riverside-to-Highland line “is virtually all street running save for the tunnels and the bridge and I don’t see that much time saving there.”

Indeed, Project Connect’s proposed line is far more of a winding, meandering route, with more traffic speed constraints and sharper turning movements, than any of the comparative peer street-running systems. It includes running in mixed traffic (Red River St.) as well as a segment through the UT campus (San Jacinto Blvd.) with heavy student pedestrian traffic crossing the alignment.

LRT systems are identified with the following designations:

BAL — Baltimore
CHA — Charlotte Lynx
DAL — Dallas DART
HOU — Houston MetroRail Red Line
LA — Los Angeles
MIN — Minneapolis-St. Paul Metro
NFK — Norfolk Tide (Hampton Roads Transit)
PHX — Phoenix Metro
SEA — Seattle Link
SLC — Salt Lake City TRAX

To simplify this comparison, we’ve included clearly identifiable route segments from both table sources, and differentiated them into Predominately Street Alignment and Predominantly Exclusive Alignment categories. For several individual systems, segments are identified in our charts as follow:

Dallas
CBD — West End to Pearl/Arts
Green Line A — West End to Fair Park
Blue Line A — West End to Ledbetter
Blue Line B — West End to Corinth
Blue Line C — Corinth to Illinois
Red Line A — CBD to Plano

Denver
Littleton — CBD to suburb of Littleton

Houston
Red — Red Line

Los Angeles
Blue — Blue Line, CBD to Long Beach

Minneapolis
Blue — Blue Line, Hiawatha
Green — Green Line, Minneapolis-St. Paul

Salt Lake City
701 — Medical Center to Ball Park
704 — West Valley Central to Airport
Sandy — CBD to suburb of Sandy

Using the data from these tabular compilations, we’ve presented a comparative summary of average schedule speeds in the following two graphs. Speed data values (mph) have been rounded to a single decimal point. The first graph presents a comparison of various predominantly street-running lines, similar to Project Connect’s proposed project. This includes an average for the actual, operating peer systems. The second graph presents average speeds for various lines and line segments in exclusive (mostly railway right-of-way) alignments. (Click either graph to enlarge.)


5_ARN_Chart-LRT-mph-street


6_ARN_Chart-LRT-mph-exclusive-rev


From this comparison, it can be seen that the average speed for Project Connect’s Highland-Riverside line, based on the projected travel time presented by the agency, is significantly above all of the peer systems running predominantly in street right-of-way. Not only does Project Connect’s line show a higher average schedule speed than any of its peer systems, but it’s a full 6.4 mph — nearly 46% — above the peer average. This seems highly implausible, particularly in view of the more convoluted, tortuous profile of the proposed alignment and the other encumbrances we’ve cited. Indeed, the travel time (and implicitly schedule speed) assumptions of Project Connect planners seem more appropriate for the operating characteristics of a route in predominantly exclusive right-of-way rather than running on streets and arterials, as they’ve designed it.

Projecting reasonably accurate travel times and speeds is important to planning any rail transit project, and not just because of plausibility with respect to public scrutiny. Travel time constitutes one of the key inputs into the ridership modeling process. Underestimating travel time, by reducing what’s called the “impedance” to the process of calculating trip generation and modal split, can readily lead to overestimation of ridership. In addition, slow travel speeds also raise the possible need for additional rolling stock to fulfill train frequency and passenger capacity requirements.

Bottom line: Project Connect planners may be estimating faster train travel speeds and shorter travel times than is realistically plausible, and the implications may be lower ridership, greater rolling stock requirements, and possibly higher operating costs than they’ve originally projected.

h1

Why Project Connect’s urban rail plan would remove just 1,800 cars a day — not 10,000

22 August 2014
Project Connect's Highland-Riverside alignment would have negligible impact on I-35 congestion. Photo via Austin.CultureMap.com.

Congested I-35 traffic has Austinites desperate for a solution, but Project Connect’s Highland-Riverside alignment would have negligible impact. Photo via Austin.CultureMap.com.

Project Connect representatives have been claiming an array of hypothetical benefits they say would result from their proposed Highland-Riverside urban rail project. Among these is “congestion relief”.

For the most part, this sweeping claim has been blurry, undefined, unquantified, and widely dismissed as ridiculous. (See Why Project Connect’s “Highland” urban rail would do nothing for I-35 congestion.)

But in promotional presentations, Project Connect personnel and supporters have repeatedly touted one specific, numerically quantified purported benefit — the claim that their urban rail project “takes 10,000 cars off the road every weekday”.


Screenshot from Project Connect slide presentation claiming Highland-Riverside rail plan would remove "10,000 cars" a day.

Screenshot from Project Connect slide presentation claiming Highland-Riverside rail plan would remove “10,000 cars” a day. (Click to enlarge.)


This figure invites scrutiny. Project Connect has also been touting a 2030 ridership projection of “18,000 a day” — although this appears to rely on flawed methodology. (See our recent analysis Project Connect’s urban rail forecasting methodology — Inflating ridership with “fudge factor”? which, adjusting for apparent methodological errors, suggests that total ridership of 12,000 per weekday is more plausible.)

In any case, of its projected total weekday ridership, Project Connect also claims that only 6,500 are “new transit riders” for the urban rail line. (Project Connect also claims “10,000 new transit riders to system” — but typically these new “system” boardings represent the combination of the new rail rider-trips plus the same passengers using feeder bus routes to access the rail.) This is consistent with industry experience, since a sizable proportion of the ridership of new rail services consists of passengers that had previously been bus transit riders.

But this “new transit riders” figure, while plausible, immediately diminishes the plausibility of the claim of “taking 10,000 cars off the road”. How could 6,500 riders, boarding trains, eliminate 10,000 cars from the road?

Furthermore, the estimate of 6,500 rider-trips (i.e., boarding passengers) actually doesn’t equal 6,500 individual passengers, i.e., persons. Why? Because (as is commonly known and accepted in the industry) a very large percentage of those trips are made by the same, individual passengers — mainly round trips, or extra trips during lunch hour, and so on.

The count of daily “boardings”, or rider trips — i.e., ridership — is actually a tally, in U.S. industry parlance, of unlinked trips. These are the string of trips on transit made over a day by the same individual person; they might include trips on a feeder or connector bus to a rail transit train, possibly other trips during the day by transit, and perhaps that person’s return trips back home by the same modes.

So, how to figure how many individual passengers (persons) are actually involved in a given ridership figure? The American Public Transportation Association (APTA) suggests a conversion factor: “APTA estimates that the number of people riding transit on an average weekday is 45% of the number of unlinked transit passenger trips.”

Thus, applying that 45% factor to those 6,500 “new rider” trips, we realize that figure represents roughly 2,925 actual passengers projected to ride the proposed urban rail line, new to the transit system.

However, we cannot assume that every one of those new passengers would have used a motor vehicle rather than riding transit. On average, about 75% have access to a car. So 2,925 passengers X 75% = 2,194 passengers that could be assumed to leave their cars off the road to ride transit. (It’s pretty much a cinch that these hypothetical transit passengers wouldn’t be driving, on average, more than four cars a day!)

To estimate more realistically how many cars would be affected, we need to factor in average car occupancy of 1.2 persons per car (to account for some carpooling). That final calculation yields 1,828 — or (by rounding for level of confidence) roughly 1,800 cars removed from the road by Project Connect’s proposed urban rail plan.

That 1,800 is an all-day figure. Using an industry rule-of-thumb of 20%, about 400 of those cars would be operated during a peak period, or roughly 100, on average, during each peak hour. As our article on I-35 congestion, cited above, indicates, the impact on I-35 traffic would be very minimal. Most of the effect of that vehicle traffic elimination would be spread among a number of major arterials — particularly Airport Blvd., Red River St., San Jacinto Blvd., Trinity St., and Riverside Drive. This impact on local arterial congestion would be small — but every little bit helps.

While the removal of 1,800 cars from central Austin roads is a far cry from 10,000, once again, every incremental bit helps. And there’s also the decreased demand for 1,800 parking spaces in the city center.

But the point is that $1.4 billion (about $1.2 billion in 2014 dollars) is a huge investment to achieve so little. For many cities, ridership at the level of 12,000 a day typically isn’t so bad, but when you’re missing the potential of 35,000-45,000 a day, plus incurring such a high cost for this level of payoff, you need to reconsider the deal. (For example, see Austin’s 2000 light rail plan — Key documents detail costs, ridership of Lamar-Guadalupe-SoCo route.)

For less than half of Project Connect’s urban rail investment cost, a “backbone” urban rail line on Guadalupe-Lamar (with a branch to the Seaholm-Amtrak area) could plausibly be expected to generate at least three times as much ridership — and eliminate roughly 5,600 cars a day from central-city streets and arterials.


Summary chart compares Project Connect's claim of taking "10,000 cars off the road every weekday" vs. (1) ARN's analysis of probable actual number of cars removed by Highland-Riverside line and (2) projected number of cars that would be removed from Austin's roadways by alternative Guadalupe-Lamar urban rail plan.

Summary chart compares Project Connect’s claim of taking “10,000 cars off the road every weekday” vs. (1) ARN’s analysis of probable actual number of cars removed by Highland-Riverside line and (2) projected number of cars that would be removed from Austin’s roadways by alternative Guadalupe-Lamar urban rail plan. (Click to enlarge.)


Now, that’s some “congestion relief” worth paying for.

h1

Project Connect gets it wrong — Urban rail starter lines are much cheaper than extensions

14 August 2014
LEFT: Denver's starter LRT line, a 5.3-mile line opened in 1994, was routed and designed as a simple, surface-routed project to minimize construction time and cost. All-surface alignment avoided heavy, expensive civil works and kept design as simple as possible. Photo: Peter Ehrlich. RIGHT: Subsequent extensions, such as this West line opened in 2013, have required bridges, grade separations, and other major civil works, resulting in a unit cost 61% higher than that of the starter line. Photo: WUNC.org.

LEFT: Denver’s starter LRT line, a 5.3-mile line opened in 1994, was routed and designed as a simple, surface-routed project to minimize construction time and cost. All-surface alignment avoided heavy, expensive civil works and kept design as simple as possible. Photo: Peter Ehrlich. RIGHT: Subsequent extensions, such as this West line opened in 2013, have required bridges, grade separations, and other major civil works, resulting in a unit cost 61% higher than that of the starter line. Photo: WUNC.org.

Since Project Connect released the cost estimates for their proposed 9.5-mile Highland-Riverside urban rail starter line last spring, agency representatives have tried to argue that the line’s projected cost of $144.8 per mile (2020 dollars) is comparable to that of other recent light rail transit (LRT) projects, citing new extensions in Houston, Portland, and Minneapolis.

Project Connect's chart comparing their proposed Highland-Riverside "Austin Urban Rail" starter line cost to costs of extensions of several other mature light rail transit systems.

Project Connect’s chart comparing their proposed Highland-Riverside “Austin Urban Rail” starter line cost to costs of extensions of several other mature light rail transit systems. (Click to enlarge.)

Austin Rail Now challenged this comparison In our recent analysis, Project Connect’s Austin urban rail would be 3rd-most-pricey LRT starter line in U.S. history. We argued that comparing the high cost of extensions of other, mature systems, was invalid, because urban rail starter lines tend to be much lower in cost than subsequent extension projects.

That’s because, in designing a starter line — the first line of a brand-new system for a city — the usual practice is to maximize ridership while minimizing costs through avoiding more difficult design and construction challenges, often deferring these other corridors for later extensions. In this way, the new system can demonstrate sufficient ridership and other measures of performance sufficient to convince both local officials and the public that it’s a success from the standpoint of being a worthwhile investment.

In contrast with starter lines, where officials and planners usually strive to keep design minimal and hold costs down in order to get an initial system up and running with the least demand on resources (and public tolerance), extension projects more often are deferred to later opportunities, mainly because they frequently contend with “the much more difficult urban and terrain conditions that are typically avoided and deferred in the process of selecting routes for original starter systems.” Deferring more difficult and expensive alignments till later also allows time for public acceptance, and even enthusiasm, for the new rail transit system to take root and grow.

Austin’s case provides an illustration. As our article, Austin’s 2000 light rail plan — Key documents detail costs, ridership of Lamar-Guadalupe-SoCo route, describes, Capital Metro’s original 2000 LRT plan envisioned a “Phase 1” 20-mile system consisting of a 14.6-mile line from McNeil to downtown, plus a short branch to East Austin and a longer extension down South Congress to Ben White Blvd. In Year of Expenditure (YOE) 2010 dollars, that full system was projected to cost $1,085.8 million (about $1,198 million in today’s dollars). But a billion-dollar project was deemed too hefty a bite for the city’s first foray into rail, so decisionmakers and planners designated the shorter 14.6-mile northern section as a Minimum Operable Segment (MOS), with a more affordable (and, hopefully, more politically palatable)pricetag of $739.0 million in 2007 YOE dollars (roughly $878 million in current dollars).

After an initial starter line is established, for most subsequent extension projects the unit cost — per mile — tends to increase because, as previously indicated, officials and designers are willing to tackle more daunting corridors and alignments. Denver is a useful example.

In 1994 Denver established basic LRT service with a comparatively simple 5.3-mile starter line, running entirely on the surface in both dedicated street lanes and an available, abandoned center-city railway alignment, with an installation cost of $37.3 million per mile (2014 dollars). From that beginning, the system has been gradually expanded with increasingly more ambitious and more costly extensions. In 2013, Denver opened its West Line (the W line) to Golden; constructed over much more daunting terrain and obstacles, with multiple grade separations, bridges, and long elevated sections, plus more complex signal and communications systems and more elaborate station facilities. The West line was finished at a cost in 2014 dollars of about $59.9 million per mile — a unit cost about 61% higher than that of the original starter line.

Despite such evidence, at an Aug. 5th urban rail forum sponsored by the Highland Neighborhood Association, Project Connect’s Urban Rail Lead, Kyle Keahey, dismissed the assertion that starter lines were lower in cost per mile than extensions. Instead, he insisted, “the reverse is true.”

Really? But this claim is refuted even by the same cases that Project Connect has presented as peer projects for comparing the estimated $144.8-million-per-mile cost (2020) of its Highland-Riverside proposal.

In the following comparative analysis, we use Project Connect’s own year-2020 cost-per-mile figures for their selected “peer” projects. For each of those we use the starter line cost-per-mile data from our earlier May 8th article (cited above), plus data for Portland’s original starter line (a 15.1-mile line opened in 1986 from central Portland to the suburb of Gresham). These unit costs, in 2014 dollars, were then escalated to year-2020 values via the 3% annual factor specified by Project connect for their own table data.

The resulting comparison is shown below:

Using Project Connect's selected LRT systems, this comparison shows that the cost per mile of new starter lines tends to be significantly less than the cost of later extensions. Graph: ARN.

Using Project Connect’s selected LRT systems, this comparison shows that the cost per mile of new starter lines tends to be significantly less than the cost of later extensions. Graph: ARN. (Click to enlarge.)

Clearly, this analysis corroborates our original assertion — based on these cases, the unit costs of LRT starter lines tend to be considerably lower than the unit cost of later extensions when these have developed into more mature systems. And, at $144.8 million per mile, the unit cost of Project Connect’s proposed 9.5-mile Highland-Riverside urban rail starter line is certainly far higher than the cost of any of the original starter lines of these selected systems — all using Project Connect’s own cases and criteria.

Q.E.D., perhaps? ■

h1

Project Connect’s urban rail forecasting methodology — Inflating ridership with “fudge factor”?

20 June 2014
Graphic: Watts Up With That blog

Graphic: Watts Up With That blog

By Susan Pantell

Recently Project Connect posted a Technical Memorandum dated 13 June 2014 from Alliance Transportation Group discussing what it describes as “Central Corridor Initial LPA Transit Ridership Forecasting Methodology and Summary Ridership Forecasts”. In this posting, researcher Susan Pantell provides a critical analysis of this memo.
Screenshot of page 1 of Alliance Transportation Group's Technical Memorandum on Project Connect's ridership forecasting methodology.

Screenshot of page 1 of Alliance Transportation Group’s Technical Memorandum on Project Connect’s ridership forecasting methodology.

This memo does not really provide data on their methodology since the model is secret. Beyond that, their documentation is largely hand-waving.

1. Most importantly, they did analysis only for 2030. FTA now requires current year ridership analysis. “Current year” is the most recent year for which data on the existing system and demographic data are available. An applicant may choose to also evaluate a 10-year or 20-year horizon, and, in that case, the current-year and future-year estimates will each count 50%. Current year ridership would be a lot lower because there is not the development around Highland or the eastern side of UT, but they did not do it.

2. They estimate 15,580 daily trips using the model, which they round up to 16,000. Then they say that on game or event days, ridership could be 20,000 or higher. So they conclude “the project team believes that the median value of 18,000 is a reasonable preliminary estimate of 2030 ridership.” At the end of the memo they explain that this is not based on their calculations, but on their assumption of a 10-15% increase in ridership based on future development (18,000 is a 15% increase).

Lyndon Henry says that is a reasonable assumption, and it may be, but it is not based on data or adequately documented in this memo. They don’t say how many days they predict ridership will be 20,000 or over. There are a lot of events in Austin, but not a lot with high ridership — only 8-9 game days for football and about 10 days for SXSW. If I assume 40 days with 21,000 ridership and 15,600 on the other days, the average comes to 16,300.

They are also accounting for the special event days by adding 25 to the annualization factor of 300 that FTA uses. In addition, they add 103,000 to the annual ridership figure to account for special events.

3. Note that they estimate that total trips for the Capital Metro system will increase by 10,700 in 2030, which is lower than the ridership estimate above because bus ridership will be reduced along the route. Based on that figure, bus ridership will go down by almost 5,000 trips.

4. “Transit fares were set at the equivalent Capital Metro fares for premium transit modes discounted to 2005 model base year dollars.”

Why are they estimating 2030 ridership based on 2005 fares? Because ridership is higher with lower fares. They are assuming $1.50 fare. Using an online calculator, $1.50 is $2.78 in 2030 dollars for a 2.5% inflation rate. (For 2020 it would be $2.02 – $2.34.) That’s assuming they don’t raise the rates beyond the inflation rate.

I calculated the ridership based on a 2030 fare of $2.78 and assuming a 0.4% decrease in transit ridership for every 1% fare increase [TCRP, Report 95, Transit Pricing and Fares, 2004, Chapter 12, p. 12-6. TCRP RRD #61, Traveler Response to Transportation System Changes, 2003, p.19]. I come up with a 2030 ridership of 12,300, as compared with their 15,580. If you add their 15% fudge factor, it comes out to 14,000. If you decrease the base ridership of 12,300 by the same percentage as they do to come up with the total system trips, it comes to 8,500 new trips for the system.

Is that worth $1.4 billion?