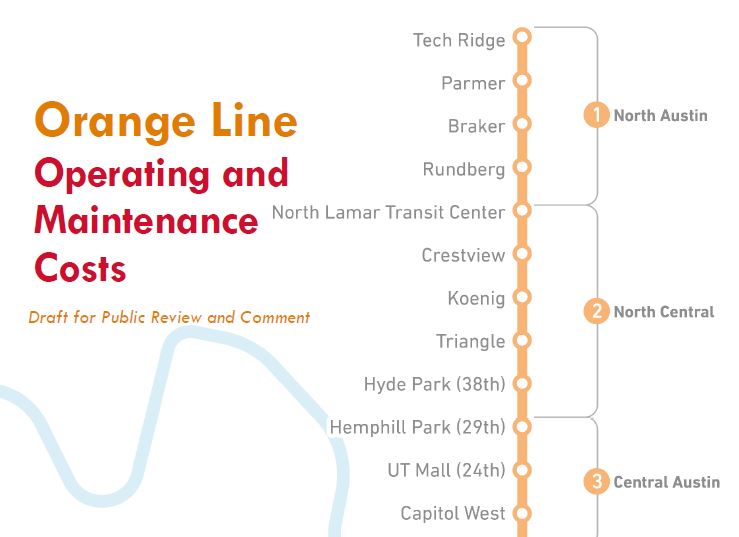
Cover of Project Connect’s O&M cost methodology and assumptions report. Screen capture by ARN.
This analysis has been adapted and revised from comments originally posted to the #ATXTransit listserv by Lyndon Henry, a technical consultant to the Light Rail Now Project and contributing editor to Austin Rail Now (ARN).
♦
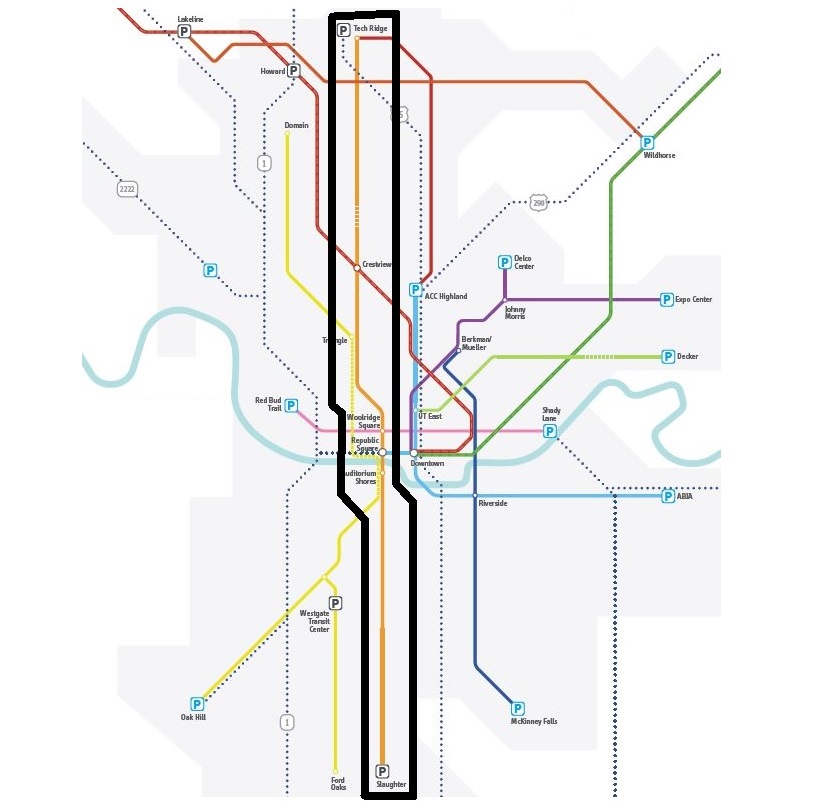
For approximately the past year, Capital Metro’s planning program, Project Connect, has been analyzing two travel corridors for major high-capacity rapid transit investment – the Orange Line (basically following the North Lamar-Guadalupe-South Congress corridor) and the Blue Line (roughly following the Red River-San Jacinto/Trinity corridor through downtown and then the Riverside corridor out to ABIA). A federally required Alternatives Analysis has been undertaken by a consulting team led by AECOM to recommend a modal system choice between light rail transit (LRT) and bus rapid transit (BRT), as well as other features and service characteristics such as vehicle types, station locations, alignments, and the capital costs and operating and maintenance (O&M) costs of each alternative.
Recently the agency released as public information selected details, including methodological procedures and cost assumptions. These have prompted scrutiny by community professionals and activists, particularly in regard to important O&M cost assumptions. In some cases these assumptions have been called into question.
For example, a 13 November posting by research analyst Julio Gonzalez Altamirano (JGA) on his Informatx.org website presented an extensive critical analysis. This resulted in two major findings:
• Project Connect’s BRT revenue hour cost estimate is lower than the national average by 26%. Project Connect does not explain its rationale for the methodological choices that lead to the lower rate.
• Project Connect’s use of a flat passenger car revenue hour rate to calculate LRT costs obfuscates the economies of scale associated with multi-car LRT trains. This is a change from the approach taken by Project Connect in 2013-2014. The new method makes Blue Line LRT appear more productive and Orange Line LRT less productive than an approach that recognizes the cost advantages of LRT scale (e.g. multi-car trains). Project Connect does not explain the rationale for the methodological switch or why its current approach will generate more accurate estimates.
These findings are broadly in line with the results of ARN’s own research into Project Connect’s O&M cost methodology and resultant assumptions, particularly with respect to the Orange Line surface LRT and BRT alternatives. Our analysis relied primarily on data for appropriate peer systems to Austin, reported in the Federal Transit Administration’s National Transit Database (NTD).
Basically, we find that Project Connect’s cost per vehicle-hour assumptions consistently seem to overestimate LRT costs by more than 51% and underestimate BRT costs by over 26%. The bottom-line result is to skew Project Connect’s O&M cost assumptions as much as 70% in favor of the BRT alternative. This produces a relatively huge disparity in evaluating the alternatives, and challenges plausibility. Details of our analysis, plus conclusions and a recommendation, are presented below.
Methodology
Operational configurations and service cycles affect O&M costs, including costs per vehicle-mile. ARN’s methodology has differed somewhat from JGA’s. Most importantly, from the 2017 NTD (latest currently available), ARN selected seven new-start LRT “peer” systems based on both urban characteristics and surface-running alignment and operational configurations that we judged to more closely match those of Austin and the proposed Orange Line surface LRT: Denver, Houston, Minneapolis, Phoenix, Portland, Sacramento, Salt Lake City. Although some have urban or suburban branches on exclusive alignments, all have significant segments in urban streets.
These seven systems have been selected in part for their urban, extensively on-surface, and in some cases predominantly street-routed character (similar to the alignment proposed for Austin’s Orange Line). Generally comparable urban population and density were also an important factor. As state capitals, Denver, Sacramento, Phoenix, Salt Lake City, and St. Paul (included in the Minneapolis-St. Paul system) also make good peer cities for Austin. Other new-start LRT systems that might have some sections on city streets but operate predominantly over extensive regional lines or grade-separated alignments were not considered as fully comparable cost models.
In contrast to our peer-systems approach, Project Connect states that, via its own methodology, “O&M unit costs for LRT service reflect a weighted national average cost per revenue hour ….” [Orange Line Operating and Maintenance Costs, 30 Oct. 2019] Apparently these costs are based on NTD data.
However, if Project Connect calculated its average from national data of all LRT systems reported in the NTD, this would have included a widely disparate collection of O&M and other data, much of it starkly dissimilar to Austin’s demographics and proposed LRT operational conditions. For example, legacy systems (remnants of historic surface electric railways dating back to the late 19th or early 20th century) such as those in Boston, San Francisco, Newark, and Pittsburgh retain a variety of older operating characteristics (e.g., onboard fare collection by train operators) that drive their vehicle-hour costs significantly higher than the average of modern new-start systems.
Other problems with such an indiscriminate approach include differences in alignment engineering configuration. Accordingly, we assessed some modern new-start LRT systems to be less suitable O&M vehicle-hour cost models for Austin’s proposed street-routed LRT Orange Line, including several we excluded particularly because of their proportionately more extensive subway and elevated segments: Buffalo, Los Angeles, St. Louis, Dallas, Seattle.
Nevertheless, despite what appear to be serious weaknesses with its own methodological assumptions, Project Connect has calculated an O&M cost per vehicle-hour of $284.15 (2017) for its Orange Line LRT surface alternative.
As regards BRT, in our judgement eight of the operational configurations of BRT systems reported in the 2017 NTD seemed to conform to the Orange Line BRT surface operating proposal, and can be assumed to represent peer systems with respect to Austin. These BRT services – operating in Cleveland, Eugene, Ft. Collins, Grand Rapids, Hartford, Kansas City, Los Angeles, and Orlando – thus provide an appropriate basis for comparing and evaluating Project Connect’s Orange Line LRT and BRT scenarios. New York City was excluded because its exceptionally high density, population size, and vast multi-model transit system are far out of proportion to Austin’s conditions. Boston’s disconnected system, partly operating as a trolleybus subway, also seemed inappropriate as a peer system. Likewise the Roaring Fork Transportation Authority’s operation, a basically rural system more closely resembling a regional or intercity motor coach service than an urban transit service, was also excluded. Data for the eight peer systems were used to develop metrics for comparison with Project Connect’s assumed cost inputs.
For 2017 O&M cost per vehicle-hour for Project Connect’s Orange Line BRT surface alternative, Project Connect’s own assumptions (based on information from CMTA and NTD) amount to an effective estimate of $119.10, as JGA has converted from Project Connect’s 2028 estimates.
To calculate current national averages and metrics for comparison, we’ve totaled current costs and other relevant values for the target LRT and BRT peer groups from National Transit Database (NTD) profile data, then calculated averages from those totals. All costs discussed are presented in 2017 dollars.
Results
►LRT: Average actual 2017 O&M cost per vehicle-hour for the seven peer LRT systems is $187.52, 34.0% lower than Project Connect’s assumed cost of $284.15 for the Orange Line surface LRT option.
►BRT: Average actual 2017 O&M cost per vehicle hour for the eight peer BRT systems is $162.23, 36.2% higher than Project Connect’s assumed cost estimate of $119.10 for the Orange Line surface BRT option.
LRT vehicle-costs/hour are typically higher than for buses mainly because LRT cars are larger and stations are also usually larger, creating higher maintenance costs. (These characteristics generally stem from LRT’s higher capacity and propensity to attract greater passenger volumes.) The ratio of actual NTD-reported peer-system LRT to BRT costs is 1.16. However, Project Connect’s cost assumptions amount to an LRT:BRT ratio of 2.39 – in other words, approximately twice the cost ratio in actual operating experience. The disparity between Project Connect’s estimates and costs experienced in actual operations is illustrated in the graph below.
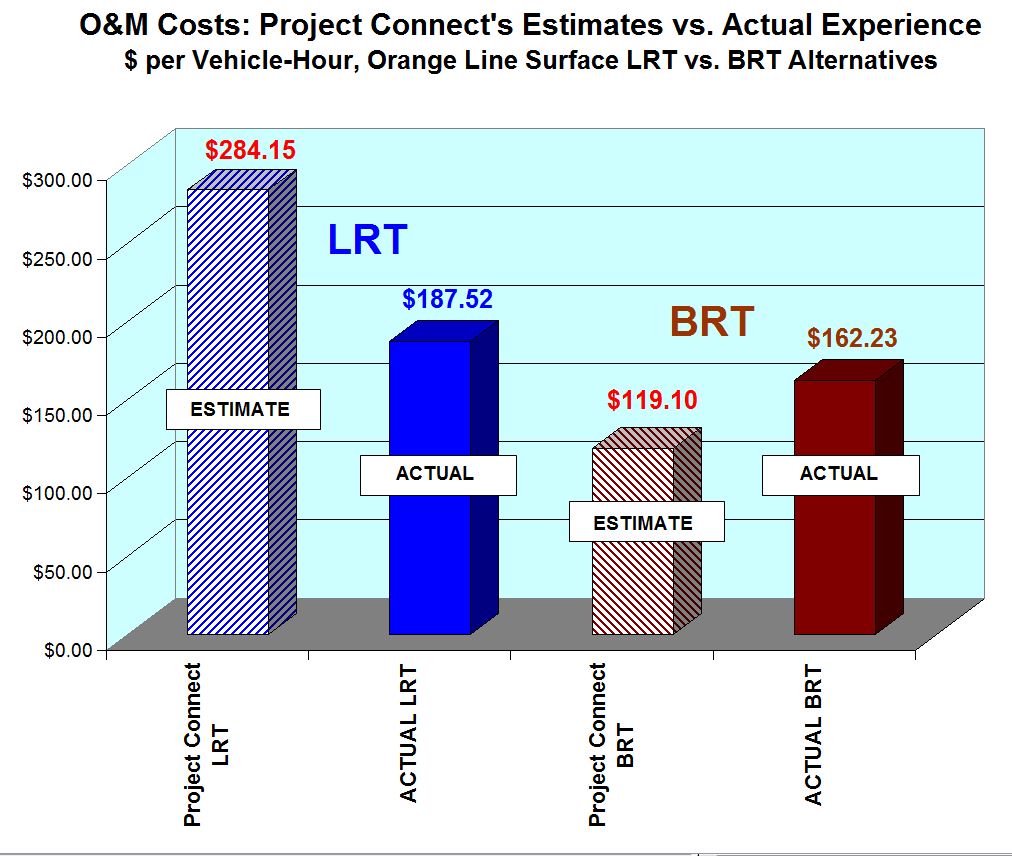
Graphic illustration of disparity between Project Connect’s O&M unit-cost estimates and actual reality of costs experienced by actual operations of comparable peer LRT and BRT systems. Graph: ARN. (Click to enlarge.)
Conclusions and recommendation
Project Connect’s assumption for cost per vehicle-hour appears to substantially underestimate BRT and overestimate LRT – and this has dramatic consequences for the agency’s overall cost model results, seemingly skewing the evaluatory process and calling into question the plausibility and validity of the agency’s O&M cost analysis. The table below, presenting Project Connect’s comprehensive O&M cost calculations for the Orange Line alternatives, illustrates how the differential in O&M cost-per-vehicle-hour estimates translate into enormous differences of tens of millions of dollars in annual O&M cost assumptions.
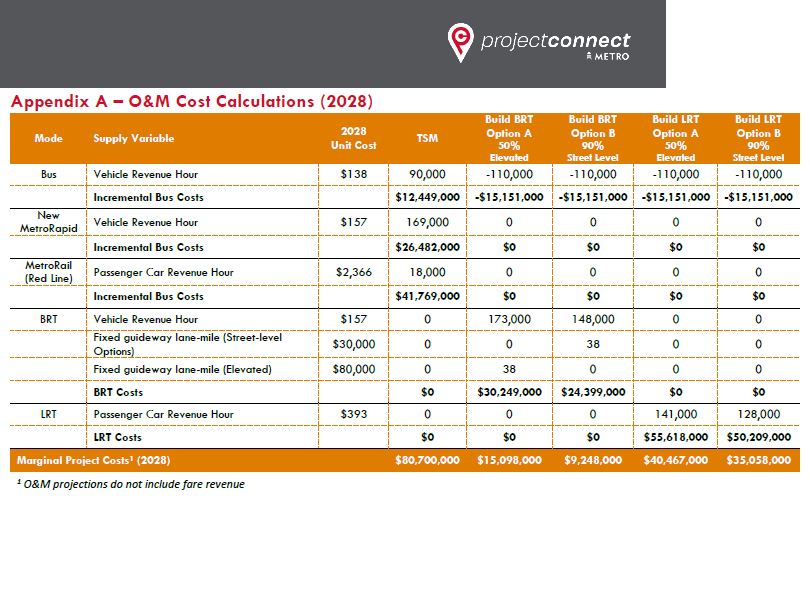
Table of O&M cost calculations from Project Connect’s report. Screen capture by ARN. (Click to enlarge.)
We would strongly recommend that these assumptions and the overall O&M analysis of these alternatives be reviewed and revised – particularly by basing cost estimates on appropriate peer systems relevant to the LRT and BRT alternatives proposed by Project Connect for the Orange Line.
■