Archive for the ‘Project Connect alternatives analysis’ Category

h1

Austin: To subway, or not to subway?

29 February 2020

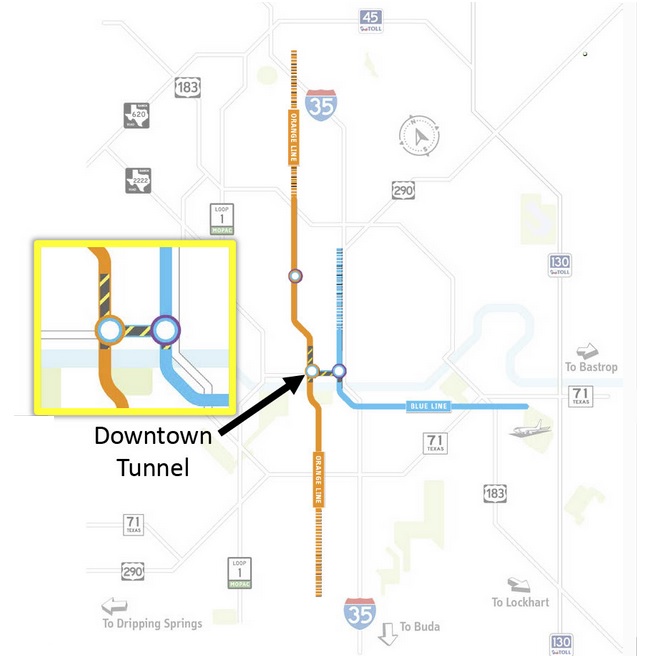
Map showing proposed downtown LRT subway. Source: Project Connect.

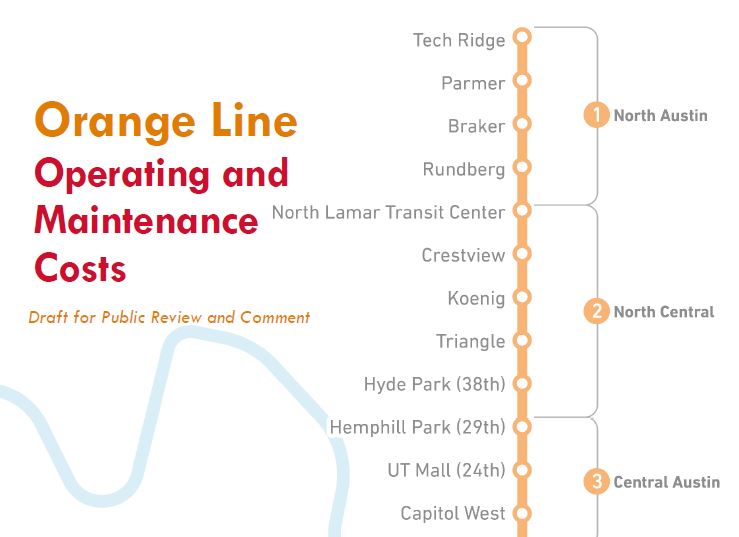
As ARN reported in our posting of 31 January, Project Connect Connect (Capital Metro’s major transit investment planning program) together with most of Austin’s top civic leadership apparently are now focusing on a massive multi-modal transit development vision with light rail transit (LRT) as its centerpiece, running in both the the Orange Line (North Lamar-Guadalupe-South Congress) and Blue Line (downtown-East Riverside-ABIA) corridors.

As we also noted, ridership volumes projected for the Orange Line are eye-popping – certainly, unusually high levels for a single U.S. starter line in a mid-sized Southwest city. Projected 2040 weekday ridership (61,600 to 73,500) would exceed or rival ridership experienced by the original single lines of relatively new major LRT projects (e.g, Los Angeles, Denver, St. Louis, Dallas, Houston) and even rail rapid transit – “heavy rail” metro – projects (e.g., Philadelphia-Lindenwold, Miami, Baltimore).

These volumes appear to underlie suggestions by Project Connect planners that segments of the proposed LRT lines, particularly in Austin’s Core Area, merit consideration as subway alignments. In addition, a segment of the Blue Line, several blocks eastward, is also considered for subway; it would feed into the Orange Line via an underground junction at Republic Square.

Need for greater capacity

Heavy peak transit passenger flows typically require more frequent trains and longer consists (number of cars per train) to provide sufficient capacity. Especially in concentrated downtowns and other central-city locations, these factors can in turn impact traffic flows across intersections by not just cars and trucks but also pedestrians, cyclists, and transit buses.

Particularly fueling interest is a subway tunnel is the length of downtown blocks (about 300 feet), which would limit train lengths to no more than three coupled LRT cars. This implies the need for a subway alignment in the Core Area north of the Colorado River (known as Lady Bird Lake) and south of Martin Luther King (MLK) Blvd. (basically, the southern border of the University of Texas campus).

In addition to eliminating conflicts with surface traffic and providing adequate capacity well into the future, the case for a subway appears to be bolstered by political support, both among the city’s top civic leadership as well as the public at large.

Subway drawbacks

On the other hand, there are significant drawbacks to subway rather than surface LRT line construction, both generally and in Austin’s case:

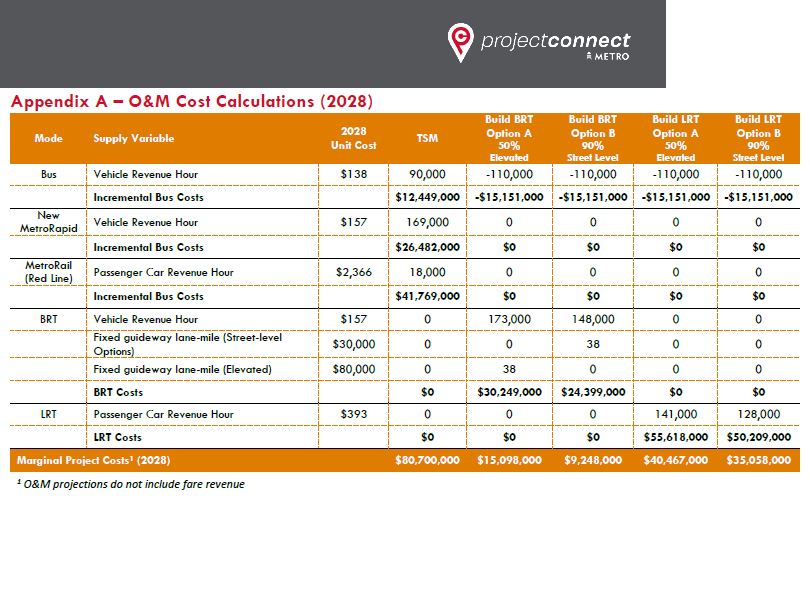
• Subway construction typically is far more expensive than surface facilities, entailing a much heavier demand on financial resources. According to cost estimates from Project Connect, building a downtown subway for an Orange Line LRT, rather than installing a surface alignment, would add nearly $837 million to the project investment cost.

• Federal Transit Administration funding is limited, and FTA officials tend to prefer more modest investment grant applications so that available funding can be spread more broadly. Increasing the cost of a New Start project significantly may render a project less competitive and lower it in the queue of projects seeking funding. Adding a downtown subway segment to, say, a starter LRT line from the North Lamar Transit Center to downtown would increase total project cost by over 65%.

• Particularly because the precise details of what’s below the surface are largely hidden, subway construction is far more prone to unexpected challenges and costs which can result in hefty budget overruns.

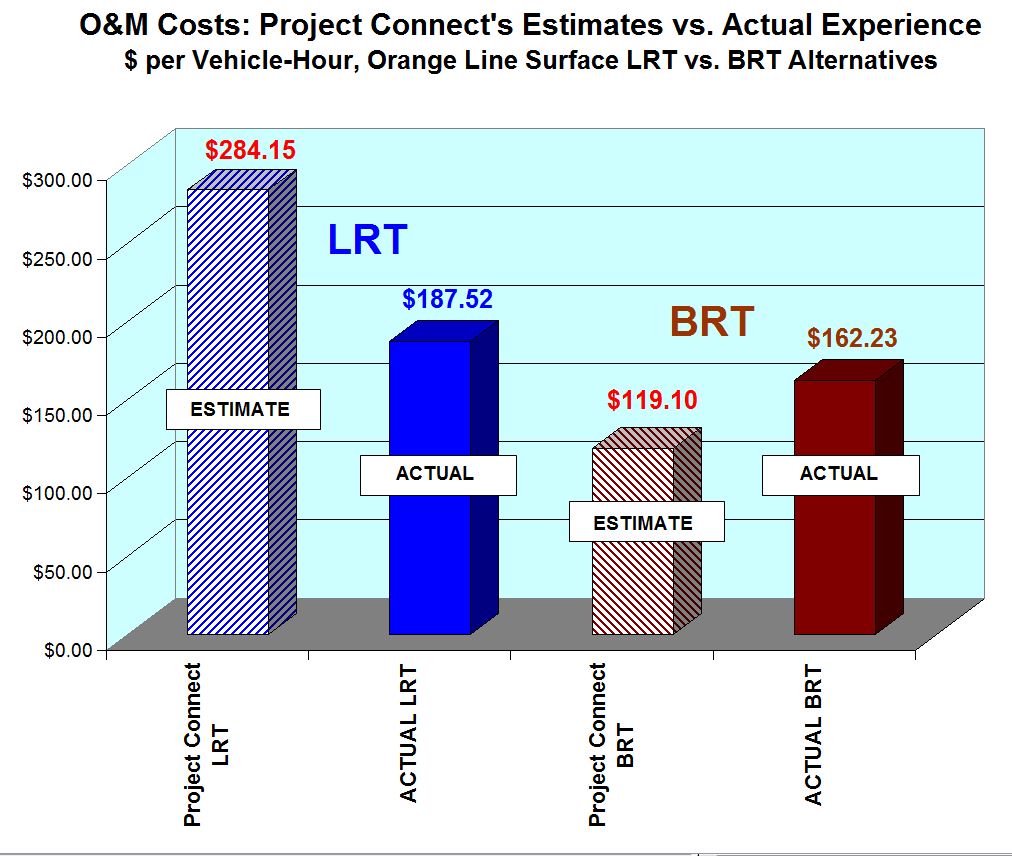
• Operating & maintenance (O&M) costs for subway LRT operation tend to be somewhat higher than for surface operation because of the added operational costs (e.g., electrical power) and functional maintenance needs of ventilation systems, elevators, escalators, etc. Also, maintenance-of-way work (maintaining track, power supply, signals, etc.) tends to be more expensive in underground conditions.

• Compared to surface LRT, where trains are run in the open and stations are easy to see and recognize – orienting the public to the available service and helping attract potential passengers – subway operations and stations are almost entirely out of sight, except for small entrances to ground level that may be difficult for the general public (especially new riders, tourists, etc.) to find and recognize.

• Access-egress to-from subway stations, which require climbing stairs, waiting for and riding elevators, or riding escalators, can be somewhat daunting. (The access time penalty is often included in ridership forecast models.) While accessing surface LRT platforms often requires waiting for traffic or pedestrian signals, typically the time penalty and physical difficulty are much less.

Capacity of an Orange Line surface LRT line

While there’s no question that a subway would provide greater potential to accommodate ridership further into the future, a technical examination of the capacity requirements to meet Project Connect’s actual predicted peak ridership volumes in the 2040 target year suggests that these could be met by a surface LRT alignment (running in dedicated street lanes) through Austin’s downtown, even with the limitation of 3-car trains running at very narrow headways (i.e., high frequencies). For example, Both Dallas and Calgary (Alberta) operate 3-car trains providing heavy capacity through downtown street alignments. Dallas runs trains as close as 4-min peak headways; Calgary runs trains as close as 2.4-min peak headways. Presumably Austin could operate trains at least as close as 3-min headways, or 20 trains per hour.

Project Connect assumes each LRT car would have a peak capacity of 172 passengers. Thus a 3-car train would provide capacity for 516 passengers. Running 20 three-car trains per hour would provide peak capacity of 10,320 riders per peak hour/peak direction. Using the rule of thumb that peak ridership in the peak direction = 10% of daily weekday ridership, this implies that surface LRT trains would provide an operating capacity capable of handling ridership up to 103,000 a day.

Project Connect forecasts daily ridership of 61,600 for the 90% street-alignment option, and 73,600 for the 50% grade-separated option. Extrapolating from the agency’s estimates, ARN calculates the annual growth rate for Project Connect’s 90% street option to be 2.2% per annum. At that rate, it would take another 24 years to reach 103,000 daily ridership level, or the year 2064 – 44 years from today – when the capacity of street running with 3-car trains would presumably be reached.

While a surface LRT line may provide adequate capacity for several decades into the future, nevertheless it’s virtually guaranteed that eventually it will not be able to meet Austin’s growing transit ridership market at some further point. Should Austin be designing a system for that far into the future? Perhaps, but this “future-proofing” strategy needs to be weighed against other considerations, such as Austin’s available bonding capacity, and the need for such a project to be competitive for relatively scarce FTA capital investment grant funding.

A downtown subway project could still be undertaken at the point of unavoidable need, 40 or 45 years from now. Salvageable surface trackage and facilities could possibly be redeployed for a surface circulator system.

Economic development potential

But capacity and operational characteristics are not the only aspects of such a major urban rail investment to be considered. Light rail – either surface or subway – can be expected to catalyze significant nearby and adjacent economic development that potentially could provide a revenue stream recompensing most, or even all, of the infrastructure investment. The tens of billions of dollars in economic development stimulated by new LRT systems in cities like Los Angeles, Dallas, Portland, Phoenix, Charlotte, Seattle, Minneapolis-St. Paul, Kansas City, Detroit, and others represent abundant evidence of these benefits.

It’s worth imagining that LRT stations (either subway or surface) in downtown Austin could stimulate the development of a major underground/above-ground commercial/shopping complex there, directly connecting with the LRT system. Models of such developments, with stores, small shops and boutiques, theatres, restaurants, and other attractions, can be found in an array of global cities with signature core-area LRT systems or metros, whereby the urban rail system provides fast, easy access to these work, shopping, dining, and recreational opportunities. Several examples include:

• Los Angeles — The Bloc (connecting to Metro and LRT subways)

• Dallas — Dallas Pedestrian Network (underground concourses with shops, food services connecting to DART LRT)

• Toronto — Massive PATH underground shopping complex connecting with six TTC subway stations, including Union Station, the city’s largest transit hub

• Montreal — Underground City, “a multi-level network of tunnels and stairways that connect various shopping malls, metro stations, offices, hotels, libraries, schools, concert halls, and restaurants” (Culture Trip)

• Edmonton — The Pedway, a network of underground concourses and aerial walkways connecting over 40 office buildings, shopping centers, and parking facilities with three LRT stations in the downtown area

And of course there are numerous other examples worldwide of similar downtown complexes integrated with urban rail stations.

Whether Project Connect’s final plan includes a subway or not, the opportunity to design Austin’s LRT stations to catalyze economic development must be a major element. And especially with this city’s role as an internationally known venue for events such as SxSW, ACL, and Formula One, the chance to transform and enrich downtown with such a major integrated complex of activity centers with urban rail should not be missed.

Advertisement
h1

Project Connect’s Orange Line operating cost assumptions seem to fail plausibility test

3 December 2019

Cover of Project Connect’s O&M cost methodology and assumptions report. Screen capture by ARN.


This analysis has been adapted and revised from comments originally posted to the #ATXTransit listserv by Lyndon Henry, a technical consultant to the Light Rail Now Project and contributing editor to Austin Rail Now (ARN).

For approximately the past year, Capital Metro’s planning program, Project Connect, has been analyzing two travel corridors for major high-capacity rapid transit investment – the Orange Line (basically following the North Lamar-Guadalupe-South Congress corridor) and the Blue Line (roughly following the Red River-San Jacinto/Trinity corridor through downtown and then the Riverside corridor out to ABIA). A federally required Alternatives Analysis has been undertaken by a consulting team led by AECOM to recommend a modal system choice between light rail transit (LRT) and bus rapid transit (BRT), as well as other features and service characteristics such as vehicle types, station locations, alignments, and the capital costs and operating and maintenance (O&M) costs of each alternative.

Recently the agency released as public information selected details, including methodological procedures and cost assumptions. These have prompted scrutiny by community professionals and activists, particularly in regard to important O&M cost assumptions. In some cases these assumptions have been called into question.

For example, a 13 November posting by research analyst Julio Gonzalez Altamirano (JGA) on his Informatx.org website presented an extensive critical analysis. This resulted in two major findings:

• Project Connect’s BRT revenue hour cost estimate is lower than the national average by 26%. Project Connect does not explain its rationale for the methodological choices that lead to the lower rate.

• Project Connect’s use of a flat passenger car revenue hour rate to calculate LRT costs obfuscates the economies of scale associated with multi-car LRT trains. This is a change from the approach taken by Project Connect in 2013-2014. The new method makes Blue Line LRT appear more productive and Orange Line LRT less productive than an approach that recognizes the cost advantages of LRT scale (e.g. multi-car trains). Project Connect does not explain the rationale for the methodological switch or why its current approach will generate more accurate estimates.

These findings are broadly in line with the results of ARN’s own research into Project Connect’s O&M cost methodology and resultant assumptions, particularly with respect to the Orange Line surface LRT and BRT alternatives. Our analysis relied primarily on data for appropriate peer systems to Austin, reported in the Federal Transit Administration’s National Transit Database (NTD).

Basically, we find that Project Connect’s cost per vehicle-hour assumptions consistently seem to overestimate LRT costs by more than 51% and underestimate BRT costs by over 26%. The bottom-line result is to skew Project Connect’s O&M cost assumptions as much as 70% in favor of the BRT alternative. This produces a relatively huge disparity in evaluating the alternatives, and challenges plausibility. Details of our analysis, plus conclusions and a recommendation, are presented below.

Methodology

Operational configurations and service cycles affect O&M costs, including costs per vehicle-mile. ARN’s methodology has differed somewhat from JGA’s. Most importantly, from the 2017 NTD (latest currently available), ARN selected seven new-start LRT “peer” systems based on both urban characteristics and surface-running alignment and operational configurations that we judged to more closely match those of Austin and the proposed Orange Line surface LRT: Denver, Houston, Minneapolis, Phoenix, Portland, Sacramento, Salt Lake City. Although some have urban or suburban branches on exclusive alignments, all have significant segments in urban streets.

These seven systems have been selected in part for their urban, extensively on-surface, and in some cases predominantly street-routed character (similar to the alignment proposed for Austin’s Orange Line). Generally comparable urban population and density were also an important factor. As state capitals, Denver, Sacramento, Phoenix, Salt Lake City, and St. Paul (included in the Minneapolis-St. Paul system) also make good peer cities for Austin. Other new-start LRT systems that might have some sections on city streets but operate predominantly over extensive regional lines or grade-separated alignments were not considered as fully comparable cost models.

In contrast to our peer-systems approach, Project Connect states that, via its own methodology, “O&M unit costs for LRT service reflect a weighted national average cost per revenue hour ….” [Orange Line Operating and Maintenance Costs, 30 Oct. 2019] Apparently these costs are based on NTD data.

However, if Project Connect calculated its average from national data of all LRT systems reported in the NTD, this would have included a widely disparate collection of O&M and other data, much of it starkly dissimilar to Austin’s demographics and proposed LRT operational conditions. For example, legacy systems (remnants of historic surface electric railways dating back to the late 19th or early 20th century) such as those in Boston, San Francisco, Newark, and Pittsburgh retain a variety of older operating characteristics (e.g., onboard fare collection by train operators) that drive their vehicle-hour costs significantly higher than the average of modern new-start systems.

Other problems with such an indiscriminate approach include differences in alignment engineering configuration. Accordingly, we assessed some modern new-start LRT systems to be less suitable O&M vehicle-hour cost models for Austin’s proposed street-routed LRT Orange Line, including several we excluded particularly because of their proportionately more extensive subway and elevated segments: Buffalo, Los Angeles, St. Louis, Dallas, Seattle.

Nevertheless, despite what appear to be serious weaknesses with its own methodological assumptions, Project Connect has calculated an O&M cost per vehicle-hour of $284.15 (2017) for its Orange Line LRT surface alternative.

As regards BRT, in our judgement eight of the operational configurations of BRT systems reported in the 2017 NTD seemed to conform to the Orange Line BRT surface operating proposal, and can be assumed to represent peer systems with respect to Austin. These BRT services – operating in Cleveland, Eugene, Ft. Collins, Grand Rapids, Hartford, Kansas City, Los Angeles, and Orlando – thus provide an appropriate basis for comparing and evaluating Project Connect’s Orange Line LRT and BRT scenarios. New York City was excluded because its exceptionally high density, population size, and vast multi-model transit system are far out of proportion to Austin’s conditions. Boston’s disconnected system, partly operating as a trolleybus subway, also seemed inappropriate as a peer system. Likewise the Roaring Fork Transportation Authority’s operation, a basically rural system more closely resembling a regional or intercity motor coach service than an urban transit service, was also excluded. Data for the eight peer systems were used to develop metrics for comparison with Project Connect’s assumed cost inputs.

For 2017 O&M cost per vehicle-hour for Project Connect’s Orange Line BRT surface alternative, Project Connect’s own assumptions (based on information from CMTA and NTD) amount to an effective estimate of $119.10, as JGA has converted from Project Connect’s 2028 estimates.

To calculate current national averages and metrics for comparison, we’ve totaled current costs and other relevant values for the target LRT and BRT peer groups from National Transit Database (NTD) profile data, then calculated averages from those totals. All costs discussed are presented in 2017 dollars.

Results

LRT: Average actual 2017 O&M cost per vehicle-hour for the seven peer LRT systems is $187.52, 34.0% lower than Project Connect’s assumed cost of $284.15 for the Orange Line surface LRT option.

BRT: Average actual 2017 O&M cost per vehicle hour for the eight peer BRT systems is $162.23, 36.2% higher than Project Connect’s assumed cost estimate of $119.10 for the Orange Line surface BRT option.

LRT vehicle-costs/hour are typically higher than for buses mainly because LRT cars are larger and stations are also usually larger, creating higher maintenance costs. (These characteristics generally stem from LRT’s higher capacity and propensity to attract greater passenger volumes.) The ratio of actual NTD-reported peer-system LRT to BRT costs is 1.16. However, Project Connect’s cost assumptions amount to an LRT:BRT ratio of 2.39 – in other words, approximately twice the cost ratio in actual operating experience. The disparity between Project Connect’s estimates and costs experienced in actual operations is illustrated in the graph below.


Graphic illustration of disparity between Project Connect’s O&M unit-cost estimates and actual reality of costs experienced by actual operations of comparable peer LRT and BRT systems. Graph: ARN. (Click to enlarge.)


Conclusions and recommendation

Project Connect’s assumption for cost per vehicle-hour appears to substantially underestimate BRT and overestimate LRT – and this has dramatic consequences for the agency’s overall cost model results, seemingly skewing the evaluatory process and calling into question the plausibility and validity of the agency’s O&M cost analysis. The table below, presenting Project Connect’s comprehensive O&M cost calculations for the Orange Line alternatives, illustrates how the differential in O&M cost-per-vehicle-hour estimates translate into enormous differences of tens of millions of dollars in annual O&M cost assumptions.


Table of O&M cost calculations from Project Connect’s report. Screen capture by ARN. (Click to enlarge.)


We would strongly recommend that these assumptions and the overall O&M analysis of these alternatives be reviewed and revised – particularly by basing cost estimates on appropriate peer systems relevant to the LRT and BRT alternatives proposed by Project Connect for the Orange Line.