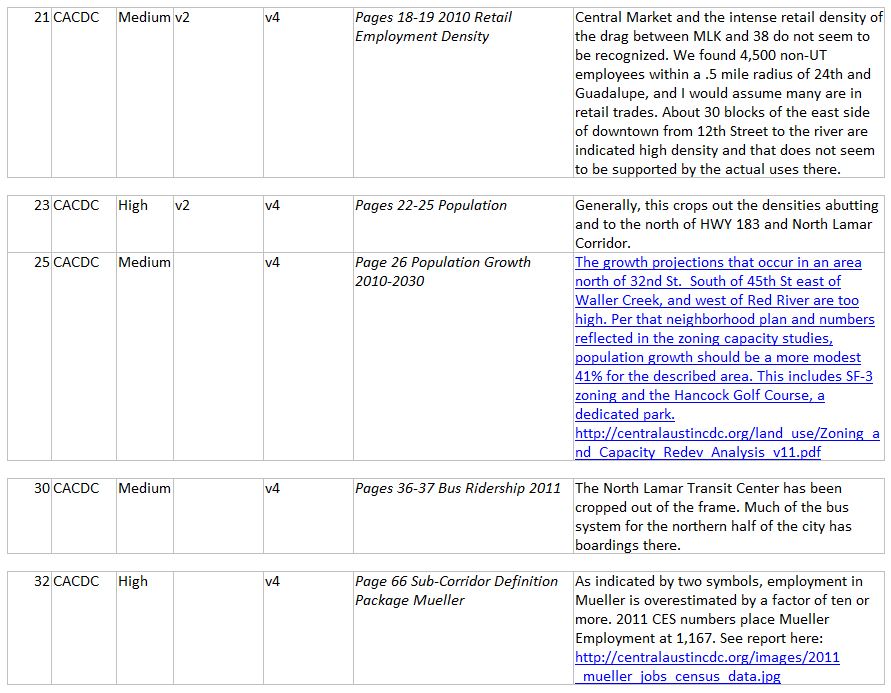
Closeup of Project Connect’s central Austin map of population density for 2010 shows intense clusters of density in West Campus, along Guadalupe above W. 29th St., and in Triangle area. Map: Rev. by LH from Project Connect.
♦
Even from the peculiarly selective and distorted data exhibited visually in Project Connect’s Map Books, it’s clear that the Guadalupe-Lamar (G-L) corridor currently has by far the highest concentration of population density within Austin central study area (and almost certainly the highest in the entire metro area). And this density appears predicted to persist in ProCon’s projection for 2030!
This density (pointed out decades ago by Lyndon Henry and Dave Dobbs as a pre-eminent justification for rail transit in this corridor) is shown in the following map graphics excerpted from the latest version (v. 5) of ProCon’s Map Book.
♦
Central study area view
♦
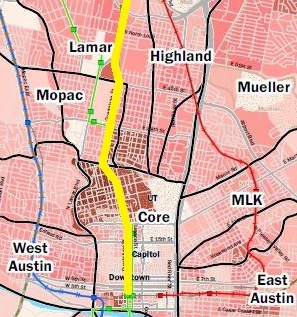
Population density in 2010 (G-L corridor spine in yellow). Map: Rev. by LH from Project Connect.
The map above shows the central-city study area (mislabeled by ProCon as a “Central Corridor”) with various sectors (mislabeled as “sub-corridors”) in 2010. The arterial spine of the G-L corridor (the most likely alignment for urban rail) is shown by a yellow line. Notice that heavy concentrations of high population density are clustered around the G-L corridor, particularly in the West Campus area, and just north of the campus, bordered by Guadalupe on the west and W. 29th St. on the south.
♦
♦

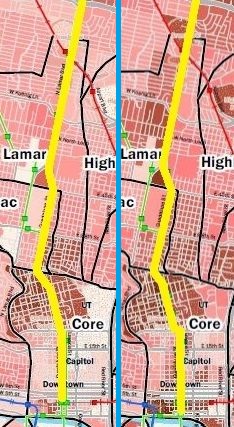
Population density projected for 2030 (G-L corridor spine in yellow). Map: Rev. by LH from Project Connect.
The map above shows the same study area and sectors, with population density concentrations projected for 2030. While these projections are far more subjective and tentative than actual current reality-based data, they do reflect speculation that extremely high density will not only intensify in 2030 in the same areas as it was located in 2010, but is expected to expand to other segments of the G-L corridor.
♦
Guadalupe-Lamar focus
♦
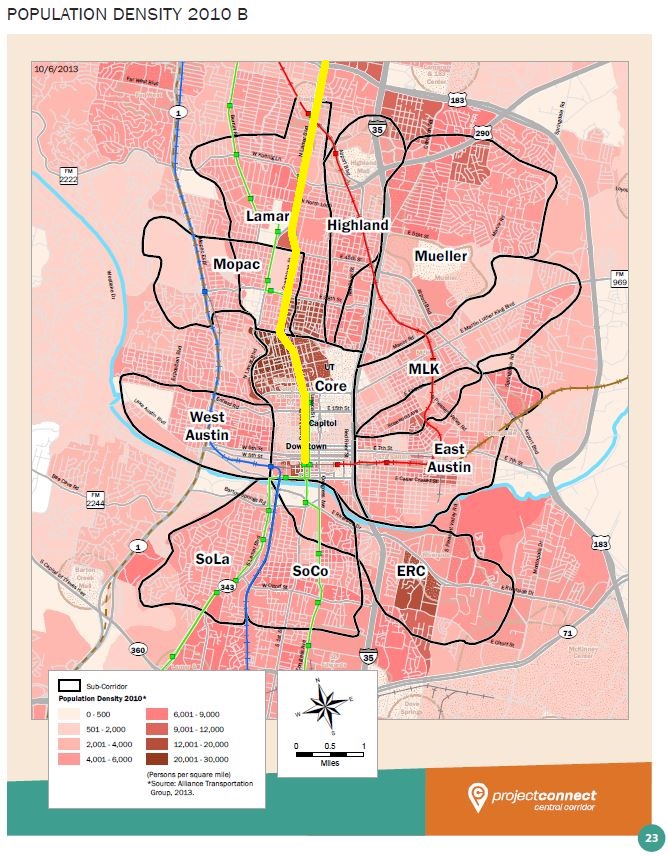
Composite of zoomed-in snips of Project Connect maps of population density. LEFT: 2010. RIGHT: 2030. Rev. by LH from Project Connect.
This composite focuses on population density the G-L corridor, showing density concentrations in 2010 on the left, and in 2030 on the right. Again, the probable alignment for urban rail is shown by a yellow line. This makes both the existing density and its projected intensification in the future even more obvious.
♦
♦
Conclusion
These data visualization maps clearly indicate that not only does the Guadalupe-Lamar corridor currently have extremely high levels of population density (as much as 30,000 persons per square mile in the West Campus) sufficient to support urban rail, but it surpasses all other corridors in the city! Furthermore, even in ProCon’s flawed analysis, this density is projected to intensify by 2030.
But this kind of bona fide corridor analysis counts for absolutely nothing in Project Connect’s “study”, because they’re not evaluating travel corridors such as Guadalupe-Lamar! They’ve been wasting taxpayer money on largely irrelevant studies of demographics and other conditions in isolated sectors while largely ignoring actual travel patterns in corridors into the core area, along with the demographics and other critical features along these actual corridors, such as G-L.
On Nov. 15th, the ProCon team are due to announce their “recommendation” for a sector (“sub-corridor”) as the location for urban rail … and it’s anybody’s guess as to what is the basis for their evaluation. But this small analysis we’ve just presented illustrates the actual kind of analysis of a travel corridor that official planners should be performing, and we suggest it as a far more effective model for the type of urban rail study this community actually should be supporting.