Archive for the ‘Urban rail ridership issues’ Category

h1

Project Connect study: Ridership potential, capacity advantages push light rail into lead

31 January 2020

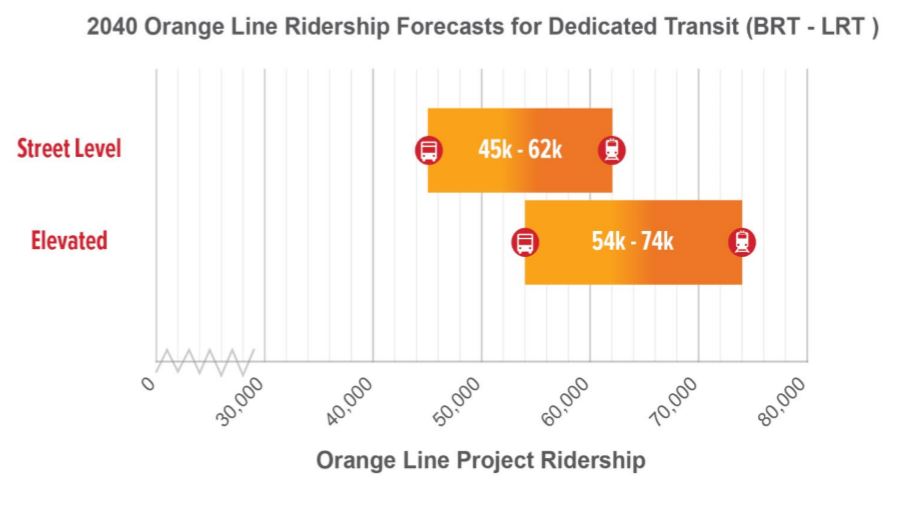
Chart shows 2040 forecast ridership for both surface (top bar) and grade-separated (lower bar) options of BRT (left end of each bar) and LRT (right end of each bar). In both cases, LRT ridership substantially exceeds that of BRT. That disparity, plus capacity limitations of BRT, seem to tip scales toward LRT. Graphic: Project Connect (click to enlarge).

In what appears to be a dramatic turn in the saga of Austin’s Project Connect planning process, Austin civic leaders, Capital Metro’s Board, and the team of Project Connect (Capital Metro’s major transit investment planning program) appear to have embraced a planning scenario backing light rail transit (LRT) for both the Orange Line (North Lamar-Guadalupe-South Congress) and Blue Line (downtown-East Riverside-ABIA).

Consensus for this option seemed to emerge during and after a joint Austin City Council/Capital Metro Board work session on 14 January. According to a report in the Austin American Statesman of that date, while LRT would cost more to build than a bus rapid transit (BRT) alternative, “a Cap Metro analysis found the [BRT] system would reach its capacity in 2040.”

In comparison, rail would offer much more potential for passenger growth. Maximum capacity for ridership on a bus rapid transit system would be reached less than a decade from when the system is completed — a fact that doomed it as an option.

Bus rapid transit “does not work … and the analysis shows that now,” Council Member Jimmy Flannigan said. “It doesn’t have the capacity we need.”

Advocates for an LRT starter line serving the Orange Line corridor have long predicted the enormous ridership potential of this route, and Project Connect’s ridership forecasts, based on the Federal Transit Administration (FTA) STOPS model integrated with a locally developed model used by the Capital Area Metropolitan Planning Organization (CAMPO), bear out these community predictions. According to Project Connect’s working forecasts in their operations & maintenance documentation, LRT ridership is projected at unusually high levels for a single new starter line.

• For the year 2028, typical weekday ridership is projected at more than 54,200 for a 50% grade separated (elevated or subway) option, and over 47,200 for a 90% surface option.

• For the year 2040, typical ridership is projected at more than 73,500 for a 50% grade separated option, and over 61,600 for a 90% surface option.

The significance of these Orange Line ridership projections for a single starter line can be assessed by placing them in perspective with ridership experienced by the original single lines of other relatively new major rail rapid transit (RRT, “heavy rail”) and LRT projects, for which data has been readily available. (Weekday ridership data from National Transit Database and American Public Transportation Association.)

Light rail lines — Los Angeles (1993) 36,600; Denver (1996) 13,500; St. Louis (2005) 40,900; Dallas (1998) 36,700; Salt Lake City (2002) 31,400; Minneapolis (2005) 25,700; Houston (2005) 36,700

Rail rapid transit (“heavy rail”) lines — Philadelphia-Lindenwold (2019) 38,900; Miami (2019) 59,000; Baltimore 38,400.


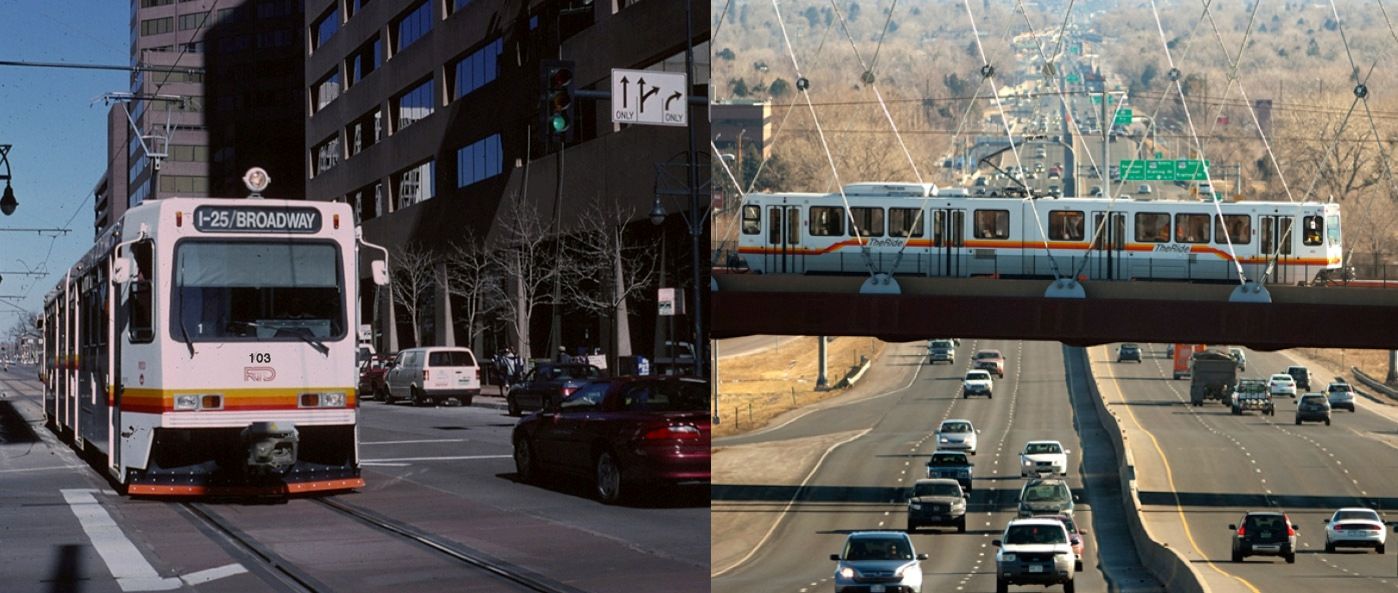
For a single-line new-start project, projected 2040 ridership for Orange Line LRT alternative seems to exceed that of even several heavy metro lines, such as this one in Baltimore. Photo: Doug Grotjahn.


It can be seen that the Orange Line projected ridership, if achieved, would fall in the range of some of the highest-ridership new single lines, both LRT and RRT, in the USA, and possibly could count as the highest achieved by any new LRT project in this country.

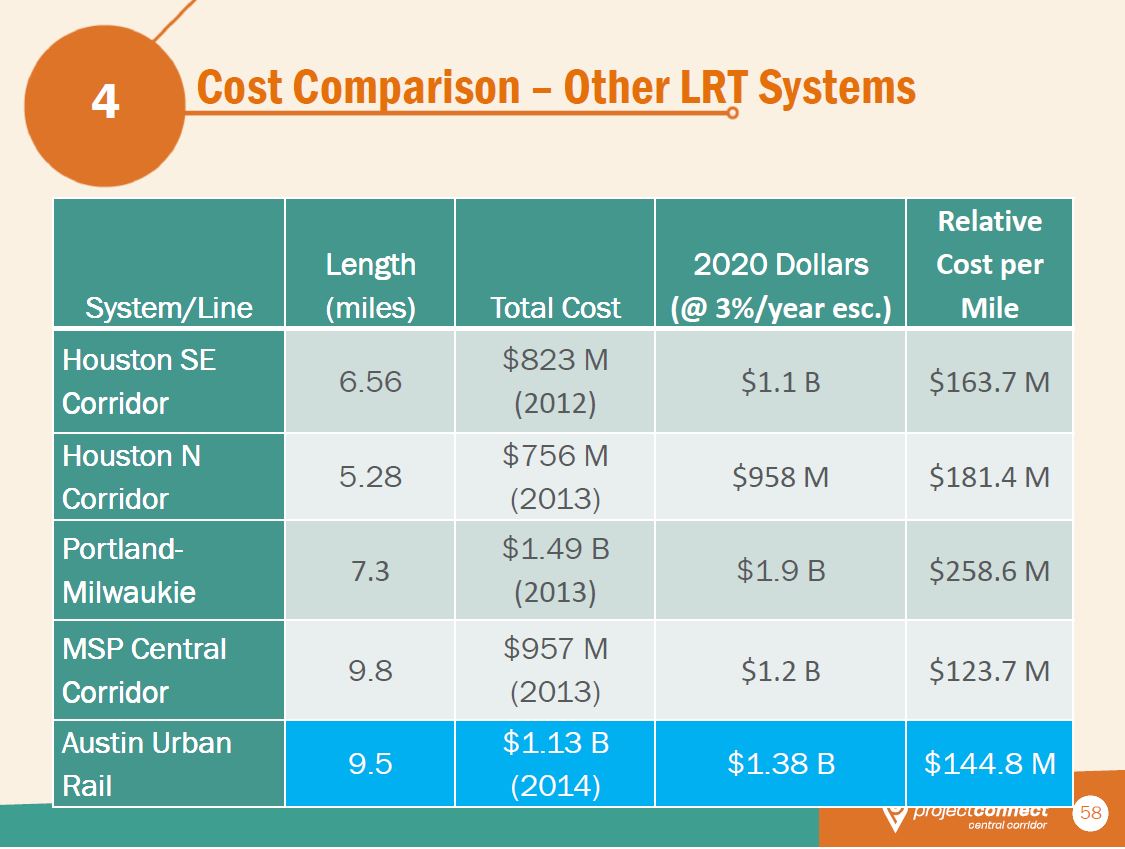
As Project Connect’s planning proceeds further, attention is focusing on critical details, including fine-tuning and finalizing capital cost estimates that would impact a major municipal bond election proposed for this coming November. Current estimates for the complete Capital Metro service area system, including numerous additional corridors with lighter BRT operations, regional rail services, and other essential transit services as well as the LRT lines, range between $3.8 and $9.4 billion, depending on options such as percentage of surface alignment vs. proposed elevated or subway segments.

Advertisement
h1

Why Project Connect’s urban rail plan would remove just 1,800 cars a day — not 10,000

22 August 2014
Project Connect's Highland-Riverside alignment would have negligible impact on I-35 congestion. Photo via Austin.CultureMap.com.

Congested I-35 traffic has Austinites desperate for a solution, but Project Connect’s Highland-Riverside alignment would have negligible impact. Photo via Austin.CultureMap.com.

Project Connect representatives have been claiming an array of hypothetical benefits they say would result from their proposed Highland-Riverside urban rail project. Among these is “congestion relief”.

For the most part, this sweeping claim has been blurry, undefined, unquantified, and widely dismissed as ridiculous. (See Why Project Connect’s “Highland” urban rail would do nothing for I-35 congestion.)

But in promotional presentations, Project Connect personnel and supporters have repeatedly touted one specific, numerically quantified purported benefit — the claim that their urban rail project “takes 10,000 cars off the road every weekday”.


Screenshot from Project Connect slide presentation claiming Highland-Riverside rail plan would remove "10,000 cars" a day.

Screenshot from Project Connect slide presentation claiming Highland-Riverside rail plan would remove “10,000 cars” a day. (Click to enlarge.)


This figure invites scrutiny. Project Connect has also been touting a 2030 ridership projection of “18,000 a day” — although this appears to rely on flawed methodology. (See our recent analysis Project Connect’s urban rail forecasting methodology — Inflating ridership with “fudge factor”? which, adjusting for apparent methodological errors, suggests that total ridership of 12,000 per weekday is more plausible.)

In any case, of its projected total weekday ridership, Project Connect also claims that only 6,500 are “new transit riders” for the urban rail line. (Project Connect also claims “10,000 new transit riders to system” — but typically these new “system” boardings represent the combination of the new rail rider-trips plus the same passengers using feeder bus routes to access the rail.) This is consistent with industry experience, since a sizable proportion of the ridership of new rail services consists of passengers that had previously been bus transit riders.

But this “new transit riders” figure, while plausible, immediately diminishes the plausibility of the claim of “taking 10,000 cars off the road”. How could 6,500 riders, boarding trains, eliminate 10,000 cars from the road?

Furthermore, the estimate of 6,500 rider-trips (i.e., boarding passengers) actually doesn’t equal 6,500 individual passengers, i.e., persons. Why? Because (as is commonly known and accepted in the industry) a very large percentage of those trips are made by the same, individual passengers — mainly round trips, or extra trips during lunch hour, and so on.

The count of daily “boardings”, or rider trips — i.e., ridership — is actually a tally, in U.S. industry parlance, of unlinked trips. These are the string of trips on transit made over a day by the same individual person; they might include trips on a feeder or connector bus to a rail transit train, possibly other trips during the day by transit, and perhaps that person’s return trips back home by the same modes.

So, how to figure how many individual passengers (persons) are actually involved in a given ridership figure? The American Public Transportation Association (APTA) suggests a conversion factor: “APTA estimates that the number of people riding transit on an average weekday is 45% of the number of unlinked transit passenger trips.”

Thus, applying that 45% factor to those 6,500 “new rider” trips, we realize that figure represents roughly 2,925 actual passengers projected to ride the proposed urban rail line, new to the transit system.

However, we cannot assume that every one of those new passengers would have used a motor vehicle rather than riding transit. On average, about 75% have access to a car. So 2,925 passengers X 75% = 2,194 passengers that could be assumed to leave their cars off the road to ride transit. (It’s pretty much a cinch that these hypothetical transit passengers wouldn’t be driving, on average, more than four cars a day!)

To estimate more realistically how many cars would be affected, we need to factor in average car occupancy of 1.2 persons per car (to account for some carpooling). That final calculation yields 1,828 — or (by rounding for level of confidence) roughly 1,800 cars removed from the road by Project Connect’s proposed urban rail plan.

That 1,800 is an all-day figure. Using an industry rule-of-thumb of 20%, about 400 of those cars would be operated during a peak period, or roughly 100, on average, during each peak hour. As our article on I-35 congestion, cited above, indicates, the impact on I-35 traffic would be very minimal. Most of the effect of that vehicle traffic elimination would be spread among a number of major arterials — particularly Airport Blvd., Red River St., San Jacinto Blvd., Trinity St., and Riverside Drive. This impact on local arterial congestion would be small — but every little bit helps.

While the removal of 1,800 cars from central Austin roads is a far cry from 10,000, once again, every incremental bit helps. And there’s also the decreased demand for 1,800 parking spaces in the city center.

But the point is that $1.4 billion (about $1.2 billion in 2014 dollars) is a huge investment to achieve so little. For many cities, ridership at the level of 12,000 a day typically isn’t so bad, but when you’re missing the potential of 35,000-45,000 a day, plus incurring such a high cost for this level of payoff, you need to reconsider the deal. (For example, see Austin’s 2000 light rail plan — Key documents detail costs, ridership of Lamar-Guadalupe-SoCo route.)

For less than half of Project Connect’s urban rail investment cost, a “backbone” urban rail line on Guadalupe-Lamar (with a branch to the Seaholm-Amtrak area) could plausibly be expected to generate at least three times as much ridership — and eliminate roughly 5,600 cars a day from central-city streets and arterials.


Summary chart compares Project Connect's claim of taking "10,000 cars off the road every weekday" vs. (1) ARN's analysis of probable actual number of cars removed by Highland-Riverside line and (2) projected number of cars that would be removed from Austin's roadways by alternative Guadalupe-Lamar urban rail plan.

Summary chart compares Project Connect’s claim of taking “10,000 cars off the road every weekday” vs. (1) ARN’s analysis of probable actual number of cars removed by Highland-Riverside line and (2) projected number of cars that would be removed from Austin’s roadways by alternative Guadalupe-Lamar urban rail plan. (Click to enlarge.)


Now, that’s some “congestion relief” worth paying for.

h1

Project Connect gets it wrong — Urban rail starter lines are much cheaper than extensions

14 August 2014
LEFT: Denver's starter LRT line, a 5.3-mile line opened in 1994, was routed and designed as a simple, surface-routed project to minimize construction time and cost. All-surface alignment avoided heavy, expensive civil works and kept design as simple as possible. Photo: Peter Ehrlich. RIGHT: Subsequent extensions, such as this West line opened in 2013, have required bridges, grade separations, and other major civil works, resulting in a unit cost 61% higher than that of the starter line. Photo: WUNC.org.

LEFT: Denver’s starter LRT line, a 5.3-mile line opened in 1994, was routed and designed as a simple, surface-routed project to minimize construction time and cost. All-surface alignment avoided heavy, expensive civil works and kept design as simple as possible. Photo: Peter Ehrlich. RIGHT: Subsequent extensions, such as this West line opened in 2013, have required bridges, grade separations, and other major civil works, resulting in a unit cost 61% higher than that of the starter line. Photo: WUNC.org.

Since Project Connect released the cost estimates for their proposed 9.5-mile Highland-Riverside urban rail starter line last spring, agency representatives have tried to argue that the line’s projected cost of $144.8 per mile (2020 dollars) is comparable to that of other recent light rail transit (LRT) projects, citing new extensions in Houston, Portland, and Minneapolis.

Project Connect's chart comparing their proposed Highland-Riverside "Austin Urban Rail" starter line cost to costs of extensions of several other mature light rail transit systems.

Project Connect’s chart comparing their proposed Highland-Riverside “Austin Urban Rail” starter line cost to costs of extensions of several other mature light rail transit systems. (Click to enlarge.)

Austin Rail Now challenged this comparison In our recent analysis, Project Connect’s Austin urban rail would be 3rd-most-pricey LRT starter line in U.S. history. We argued that comparing the high cost of extensions of other, mature systems, was invalid, because urban rail starter lines tend to be much lower in cost than subsequent extension projects.

That’s because, in designing a starter line — the first line of a brand-new system for a city — the usual practice is to maximize ridership while minimizing costs through avoiding more difficult design and construction challenges, often deferring these other corridors for later extensions. In this way, the new system can demonstrate sufficient ridership and other measures of performance sufficient to convince both local officials and the public that it’s a success from the standpoint of being a worthwhile investment.

In contrast with starter lines, where officials and planners usually strive to keep design minimal and hold costs down in order to get an initial system up and running with the least demand on resources (and public tolerance), extension projects more often are deferred to later opportunities, mainly because they frequently contend with “the much more difficult urban and terrain conditions that are typically avoided and deferred in the process of selecting routes for original starter systems.” Deferring more difficult and expensive alignments till later also allows time for public acceptance, and even enthusiasm, for the new rail transit system to take root and grow.

Austin’s case provides an illustration. As our article, Austin’s 2000 light rail plan — Key documents detail costs, ridership of Lamar-Guadalupe-SoCo route, describes, Capital Metro’s original 2000 LRT plan envisioned a “Phase 1” 20-mile system consisting of a 14.6-mile line from McNeil to downtown, plus a short branch to East Austin and a longer extension down South Congress to Ben White Blvd. In Year of Expenditure (YOE) 2010 dollars, that full system was projected to cost $1,085.8 million (about $1,198 million in today’s dollars). But a billion-dollar project was deemed too hefty a bite for the city’s first foray into rail, so decisionmakers and planners designated the shorter 14.6-mile northern section as a Minimum Operable Segment (MOS), with a more affordable (and, hopefully, more politically palatable)pricetag of $739.0 million in 2007 YOE dollars (roughly $878 million in current dollars).

After an initial starter line is established, for most subsequent extension projects the unit cost — per mile — tends to increase because, as previously indicated, officials and designers are willing to tackle more daunting corridors and alignments. Denver is a useful example.

In 1994 Denver established basic LRT service with a comparatively simple 5.3-mile starter line, running entirely on the surface in both dedicated street lanes and an available, abandoned center-city railway alignment, with an installation cost of $37.3 million per mile (2014 dollars). From that beginning, the system has been gradually expanded with increasingly more ambitious and more costly extensions. In 2013, Denver opened its West Line (the W line) to Golden; constructed over much more daunting terrain and obstacles, with multiple grade separations, bridges, and long elevated sections, plus more complex signal and communications systems and more elaborate station facilities. The West line was finished at a cost in 2014 dollars of about $59.9 million per mile — a unit cost about 61% higher than that of the original starter line.

Despite such evidence, at an Aug. 5th urban rail forum sponsored by the Highland Neighborhood Association, Project Connect’s Urban Rail Lead, Kyle Keahey, dismissed the assertion that starter lines were lower in cost per mile than extensions. Instead, he insisted, “the reverse is true.”

Really? But this claim is refuted even by the same cases that Project Connect has presented as peer projects for comparing the estimated $144.8-million-per-mile cost (2020) of its Highland-Riverside proposal.

In the following comparative analysis, we use Project Connect’s own year-2020 cost-per-mile figures for their selected “peer” projects. For each of those we use the starter line cost-per-mile data from our earlier May 8th article (cited above), plus data for Portland’s original starter line (a 15.1-mile line opened in 1986 from central Portland to the suburb of Gresham). These unit costs, in 2014 dollars, were then escalated to year-2020 values via the 3% annual factor specified by Project connect for their own table data.

The resulting comparison is shown below:

Using Project Connect's selected LRT systems, this comparison shows that the cost per mile of new starter lines tends to be significantly less than the cost of later extensions. Graph: ARN.

Using Project Connect’s selected LRT systems, this comparison shows that the cost per mile of new starter lines tends to be significantly less than the cost of later extensions. Graph: ARN. (Click to enlarge.)

Clearly, this analysis corroborates our original assertion — based on these cases, the unit costs of LRT starter lines tend to be considerably lower than the unit cost of later extensions when these have developed into more mature systems. And, at $144.8 million per mile, the unit cost of Project Connect’s proposed 9.5-mile Highland-Riverside urban rail starter line is certainly far higher than the cost of any of the original starter lines of these selected systems — all using Project Connect’s own cases and criteria.

Q.E.D., perhaps? ■

h1

Three “incontrovertible facts” about urban rail proposals in Austin

2 August 2014
ACC's map from its own website (annotated by Austin Rail Now) shows ACC campus (marked with inverted blue "teardrop" with MetroRail's Highland station at its northwest corner.

ACC’s map from its own website (annotated by Austin Rail Now) shows ACC campus (marked with inverted blue “teardrop”) with MetroRail’s Highland station at its northwest corner.

By Andrew Clements

The following commentary has been slightly adapted from an original Letter to the Editor published July 21st by the Austin Chronicle.

On June 26th, the City Council endorsed Project Connect’s urban rail line route. Public testimony was limited, but I would have pointed out three incontrovertible facts.

(1) The first is that the approved route terminates at the old Highland Mall, with no plans to extend any further. Every initial line, as part of any transit system, should have plans to be extended, but this one isn’t. Terminating Austin’s initial urban rail line there is proven illogical by no plans to extend it.

(2) And doubly illogical because, second, the entire proposed redevelopment is already served by passenger rail. As shown in ACC’s own map at the top of this post (with annotations by ARN), the Highland station on the MetroRail Red Line is within a half-mile of the entire Highland Mall site – the distance passengers are willing to walk in a transit trip.

Spending hundreds of millions of dollars on a tunnel, and placing new rail on Airport Boulevard (paralleling, only a few feet away, the already existing Red Line passenger rail) to reach a planned redevelopment already served by voter-approved (and funded) passenger rail is a very expensive double service.


Closeup of Highland ACC segment of Project Connect's proposed urban rail map shows how the proposed urban rail line (orange) would effectively duplicate the existing MetroRail Red Line paralleling Airport Blvd. (MetroRail drawn as red line, with Highland station shown as red dot near top of map). Project Connect line would terminate at ACC administration building on far east side of campus, with no plans for extension, and no available corridor for extension. Map: Screenshot by ARN, from Project Connect map.

Closeup of Highland ACC segment of Project Connect’s proposed urban rail map shows how the proposed urban rail line (orange) would effectively duplicate the existing MetroRail Red Line paralleling Airport Blvd. (MetroRail drawn as red line, with Highland station shown as red dot near top of map). Project Connect line would terminate at ACC administration building on far east side of campus, with no plans for extension, and no available corridor for extension. Map: Screenshot by ARN, from Project Connect map.


(3) Third, the projected ridership for the Guadalupe/North Lamar light rail route, considered by voters in 2000, was twice what is proposed now. Higher ridership indicates overall success of a rail line, which means federal funding is more likely, with a likelihood of more voter support of the next urban rail line. Guadalupe and North Lamar is where millions of dollars were spent, in 1999-2000, in an already approved federal study determining where rail should be.


Screenshot from Federal Transit Administration's New Start summary table of Capital Metro's 2000 urban rail (light rail transit) plan. Projected daily ridership (circled in red) of 37,400 is more than double the 18,000 Project Connect claims for its current Highland-Riverside proposal — and more than triple a more realistic figure of 12,000. Annotation: ARN.

Screenshot from Federal Transit Administration’s New Start summary table of Capital Metro’s 2000 Guadalupe-Lamar urban rail (light rail transit) plan. Projected daily ridership (circled in red) of 37,400 is more than double the 18,000 Project Connect claims for its current Highland-Riverside proposal — and more than triple a more realistic figure of 12,000. Annotation: ARN.


Mayor Leffingwell has coined the phrase “rail or fail”. A November referendum will likely fail, because the mayor has unfortunately led a special-interest-dominated effort that has not considered neighborhood and rail advocate voices, but instead a process where the data has been manipulated to a point where the result is anything but objective. Rail advocates like me hope that following a likely November referendum failure, we can immediately begin planning, and achieving, rail on Guadalupe/North Lamar. ■

h1

Project Connect’s urban rail forecasting methodology — Inflating ridership with “fudge factor”?

20 June 2014
Graphic: Watts Up With That blog

Graphic: Watts Up With That blog

By Susan Pantell

Recently Project Connect posted a Technical Memorandum dated 13 June 2014 from Alliance Transportation Group discussing what it describes as “Central Corridor Initial LPA Transit Ridership Forecasting Methodology and Summary Ridership Forecasts”. In this posting, researcher Susan Pantell provides a critical analysis of this memo.
Screenshot of page 1 of Alliance Transportation Group's Technical Memorandum on Project Connect's ridership forecasting methodology.

Screenshot of page 1 of Alliance Transportation Group’s Technical Memorandum on Project Connect’s ridership forecasting methodology.

This memo does not really provide data on their methodology since the model is secret. Beyond that, their documentation is largely hand-waving.

1. Most importantly, they did analysis only for 2030. FTA now requires current year ridership analysis. “Current year” is the most recent year for which data on the existing system and demographic data are available. An applicant may choose to also evaluate a 10-year or 20-year horizon, and, in that case, the current-year and future-year estimates will each count 50%. Current year ridership would be a lot lower because there is not the development around Highland or the eastern side of UT, but they did not do it.

2. They estimate 15,580 daily trips using the model, which they round up to 16,000. Then they say that on game or event days, ridership could be 20,000 or higher. So they conclude “the project team believes that the median value of 18,000 is a reasonable preliminary estimate of 2030 ridership.” At the end of the memo they explain that this is not based on their calculations, but on their assumption of a 10-15% increase in ridership based on future development (18,000 is a 15% increase).

Lyndon Henry says that is a reasonable assumption, and it may be, but it is not based on data or adequately documented in this memo. They don’t say how many days they predict ridership will be 20,000 or over. There are a lot of events in Austin, but not a lot with high ridership — only 8-9 game days for football and about 10 days for SXSW. If I assume 40 days with 21,000 ridership and 15,600 on the other days, the average comes to 16,300.

They are also accounting for the special event days by adding 25 to the annualization factor of 300 that FTA uses. In addition, they add 103,000 to the annual ridership figure to account for special events.

3. Note that they estimate that total trips for the Capital Metro system will increase by 10,700 in 2030, which is lower than the ridership estimate above because bus ridership will be reduced along the route. Based on that figure, bus ridership will go down by almost 5,000 trips.

4. “Transit fares were set at the equivalent Capital Metro fares for premium transit modes discounted to 2005 model base year dollars.”

Why are they estimating 2030 ridership based on 2005 fares? Because ridership is higher with lower fares. They are assuming $1.50 fare. Using an online calculator, $1.50 is $2.78 in 2030 dollars for a 2.5% inflation rate. (For 2020 it would be $2.02 – $2.34.) That’s assuming they don’t raise the rates beyond the inflation rate.

I calculated the ridership based on a 2030 fare of $2.78 and assuming a 0.4% decrease in transit ridership for every 1% fare increase [TCRP, Report 95, Transit Pricing and Fares, 2004, Chapter 12, p. 12-6. TCRP RRD #61, Traveler Response to Transportation System Changes, 2003, p.19]. I come up with a 2030 ridership of 12,300, as compared with their 15,580. If you add their 15% fudge factor, it comes out to 14,000. If you decrease the base ridership of 12,300 by the same percentage as they do to come up with the total system trips, it comes to 8,500 new trips for the system.

Is that worth $1.4 billion?