
Huge problems cited with Project Connect’s urban rail study data
3 November 2013
Cover of Project Connect’s Map Book version 4. Screen capture: L. Henry.
♦
One of the most serious flaws in Project connect’s urban rail study process — in which top-level officials and planners are trying to rush to a selection of an Austin city sector for an urban rail starter line on or about November 15th — is problems with data inaccuracy and outright omissions. Focused on designated alternative city sectors (misnamed “sub-corridors”), the study team has been compiling purported data on demographic and transportation features of each sector (such as population, density, transit ridership, etc.) in a series of data-visualization “Map Books” (each new one an update of the previous one).
Map Books rife with data problems
Meanwhile, as this blog reported in a previous posting, Scott Morris, head of the Central Austin Community Development Corporation (CACDC) has been relentlessly and tediously scrutinizing each volume of Map Book data. As we’ve noted “Scott has performed amazingly detailed and well-supported research into these data issues, and he has found and pointed to a lengthy array of dozens of mostly serious errors. A handful of these have been quietly rectified.”
By far, as the Oct. 27th article Project Connect admits major data error in Guadalupe-Lamar corridor study highlighted, “One of the most serious data anomalies that Scott has recently detected is the “disappearance” of virtually all the ridership for Capital Metro’s routes #1M/L and #101, the heaviest-ridership transit routes in the system, serving the G-L corridor as well as South Congress.” As the article reports, Project Connect has publicly admitted that error and corrected it in the next Map Book edition.
Map Book errors go uncorrected
However, an unacceptable large number of similar errors — predominantly erroneous data or outright omissions — remain. The following are just some of the most egregious problems in Map Book v. 2, still carried into v. 4, that Scott has found and cited in a listing submitted by CACDC to the Project Connect urban rail study team:
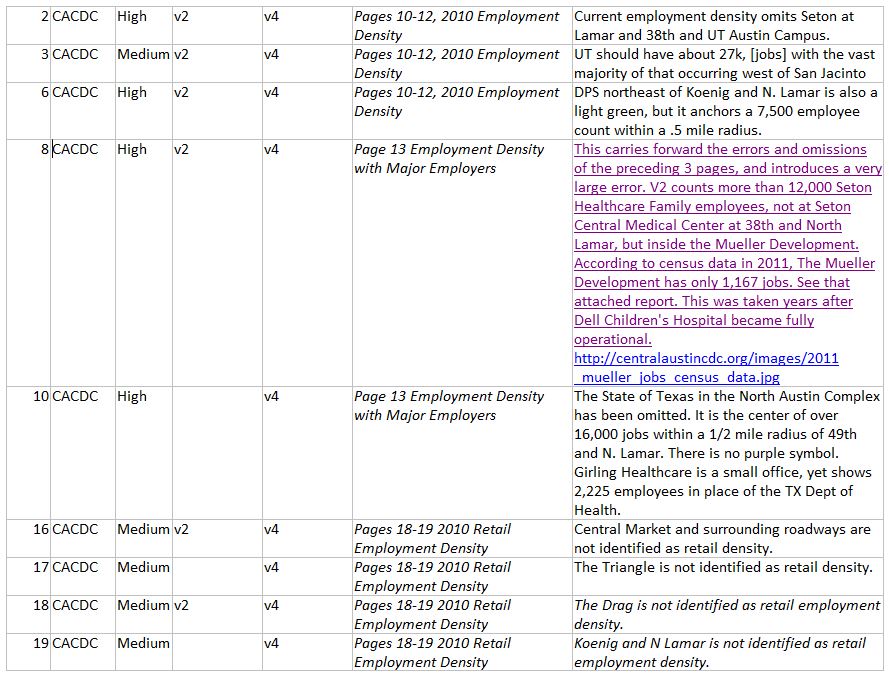
Partial listing of major errors in Project Connect Map Book and other material identified by CACDC. Screen image: L. Henry.
New error problems with Map Book 4
Scott has appended a listing of major new problems appearing in Map Book Version 4; here’s a summary:
• All “B” Pages and Definition Packages
West University NPA/University Neighborhood Overlay Removed From Defined Sub-Corridors A large, dense city area to the west of the UT campus and Guadalupe Street was moved out of the North Lamar and Mopac Sub-Corridors by the Project Team in response to a request to include UT in the core. This change was made in the current map. We understand the reasoning in placing UT in the core, however the manner in which surrounding non-UT areas were moved with it will create large, unintended impacts on the sub-corridor evaluation process. That area is not a part of UT, nor in the opinion of West Campus residents, can it be adequately served by a San Jacinto alignment on the UT Campus. West University is the densest planning area of our city that also employs over 5,000 people (Non-UT). The area west of Guadalupe anchors the Guadalupe-North Lamar Sub-Corridor and includes the University Neighborhood Overlay and 3 residential neighborhoods that are components of a City of Austin Central Austin Combined Neighborhood Planning Area. West Campus is the largest population differentiator in our city for the purposes of sub-corridor analysis. In our opinion, it should not be considered a common element to the core joining the CBD, UT, and the Capitol Complex, unless it receives a similar commitment to service. In the end, if it is desired to count West Campus as part of the core, we should also count on serving it directly as part of the definition of the core.• Page 13 Employment Density with Major Employers
The State of Texas in the North Austin Complex has been omitted. It is the center of over 16,000 jobs within a 1/2 mile radius of 49th and N. Lamar. There is no purple symbol. Girling Healthcare is a small office, yet shows 2,225 employees in place of the TX Dept of Health.• Page 28 Poverty, Vehicles, Affordable Housing
Hundreds of units of affordable housing in West Campus is not identified with the correctly-sized circle.• Pages 36-37 Bus Ridership 2011
The North Lamar Transit Center has been cropped out of the frame. Much of the bus system for the northern half of the city has boardings there.• Pages 55-59 Sub-Corridor Definition Package Lamar
Population Studies are not provided for North Lamar sub-corridor definition package.• Pages 15-16. Employment Growth
Austin State Hospital should show >100% Growth. This is an identified P3.• Pages 18-19 2010 Retail Employment Density
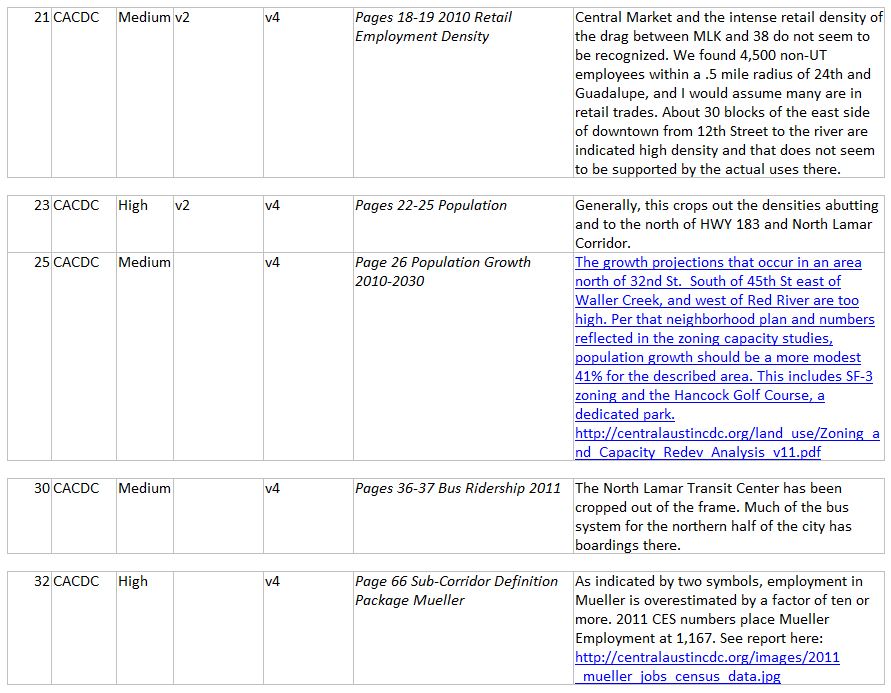
The Triangle is not identified as retail density.• Pages 18-19 2010 Retail Employment Density
Koenig and N Lamar is not identified as retail employment density.• Page 26 Population Growth 2010-2030
The growth projections that occur in an area north of 32nd St. South of 45th St east of Waller Creek, and west of Red River are too high. Per that neighborhood plan and numbers reflected in the zoning capacity studies, population growth should be a more modest 41% for the described area. This includes SF-3 zoning and the Hancock Golf Course, a dedicated park. http://centralaustincdc.org/land_use/Zoning_and_Capacity_Redev_Analysis_v11.pdf• Page 30 Selected Land Use 2010
Adams Hemphill Park straddling 30th not identified as open space.
CACDC also provides data references as the basis for these corrections.
Summary
It’s understandable that some data problems will be encountered in almost any major study of this kind. What’s astounding, however, is the high number of problems in Project Connect’s urban rail study. Even worse is that almost all of them — even when identified — seem to be going uncorrected!
This seriously compromises the competency of this entire study process (and there are even more fundamental issues involved, as this blog will address). The data problem is especially threatening because data analysis is supposedly the foundation for decisionmaking to select an urban rail corridor; the Central Corridor Advisory Group (CCAG, whose recommendation is a key part of the process) is being led through a process of data scrutiny and analysis by Project Connect staff. Yet the Project Connect team — under duress from high-level local officials eager to force a quick decision on urban rail, and apparently overwhelmed by the need to rush to an imminent recommendation for the Austin City Council — seem merely to be “dumping” volumes of data with little regard for its reliability or relevance to the basic goal of selecting an urban rail route.
All of this calls into question just how “fair and balanced” — and accurate, reliable, and truly data-based — the process of comparatively evaluating alternative urban rail corridors and plans actually is.
What the final outcome will be, and whether its integrity will be accepted by the Austin public and voters in particular, remains to be seen.


Right off the bat you can see that this list of “errors” are often not errors at all, but the result of flawed assumptions by Lamar route advocates. For instance, #3 states that the vast majority of jobs at UT are west of San Jacinto but in reality the opposite is true.
CACDC is assuming that UT staff is equally spread among existing buildings. That’s wrong. For years, UT has concentrated classroom space on the west part of campus, pushing staff east.
Specifically:
All 8 facilities and maintenance buildings are on the east side of campus.
The UT Police Department is east of San Jacinto.
The University of Texas Press is located east.
The University Interscholastic League is close to outgrowing its 3 story building on the east side.
The 4 story UT Development office is east.
Libraries require a lot of staff. Of the 14 libraries on campus, 2 are closer to Guadalupe, 3 are equidistant from Guadalupe and San Jacinto and 9 are closer to San Jacinto.
Of the 8 centers and museums, 6 are on the east side of campus.
Both the Computational Resources building and the big new Texas Advanced Computing Center are east.
The two University Child Development Centers are east.
The UT Mail Services building is east.
UT sports bring in a lot of $ and employ a lot of staff for events, coaching, training and media – all on the east side of campus.
The Performing Arts complexes require a lot of staff and are east.
A majority of on campus student housing (with associated food service) is either adjacent to San Jacinto or much closer to it than to Guadalupe.
The huge new Student Activities Center is on San Jacinto.
This doesn’t even consider the concentration of workers that will be found at the new training hospital when it is built.
It would be helpful to have an actual demographic tabulation of employment concentrations on the UT campus, but even a precursory glance at a UT campus map and the location of key buildings would quickly suggest to most reasonable observers that the majority of UT employees are probably concentrated west of San Jacinto, as the CACDC critique asserts. See for example:
http://www.utexas.edu/events/exploreut/map.html
— ARN editor
A tangentially related question: How do we count UT students? Are they ’employed’ at UT? In some sense they should be, as their commute patterns peak at similar times as FTEs do.
Yes, there are fairly strong similarities between travel behavior of students and employees. Also, let’s keep in mind that a significant number of students have part-time jobs in the UT area, both on campus and off. We need a good tabulation of TOTAL jobs in smaller organizations both off-campus and along the entire G-L corridor (so far, Project Connect has focused solely on MAJOR employers each with hundreds of jobs).
Project Connect staff seem to think West Campus neighborhood student travel is almost totally confined to ped/bike or shuttlebus transport between home and campus, but this is very simplistic — students make lots of trips away from the campus area, e.g. to more remote part-time jobs, to shopping, to recreation, etc. Equally simplistic is the long-standing notion that typical students in the West Campus will readily walk all the way east across the campus to San Jacinto to catch LRT.
— ARN editor
#8 is another map book “error” that is not an error, but a flawed assumption.
CACDC wonders why 12,000 Seton employees are counted, not at the Seton Medical Center near 38th and Lamar, but in Mueller. The answer is easy to find. In 2009 a huge number of Seton employees left 38th and moved to the new administrative office at Mueller. This exodus from 38th and Lamar likely proves CACDC’s error #2 as well.
“The new Seton Family of Hospitals Administration Offices, located at 1345 Philomena St. just south of Seton’s Dell Children’s Medical Center of Central Texas (east of I-35 and between 51st St. and Airport Blvd.), consolidates the majority of Seton’s leadership and administrative staff in one central location. … Approximately 700 Seton associates have relocated to the new office building, including human resources, facilities, legal services, finance, marketing, planning and administrative leadership. Prior to the move, Seton’s administration offices were located at Seton Medical Center
Austin (SMCA) and in numerous other locations. The vacated space at SMCA will be redesigned to accommodate patients and hospital administration”.
https://www.seton.net/about_seton/news/2009/03/02/seton_family_of_hospitals_celebrates_move_to_east_austin
700 admin employees is sizable employment, but far short of the 12,000 noted by CACDC. The heavy employment in any medical institution involves the actual medical professionals (or certainly should do).
And, as the quote states, the vacated space at Seton Medical Center Austin (SMCA) “will be redesigned to accommodate patients and hospital administration….” Surely they’re not expanding to accommodate patients without the personnel to provide care. So, why aren’t 12,000 or so employees counted at Lamar/38th in the Project Connect tally?
— ARN editor
Moving on, the very next “error” is labeled as “High” but the reality is that it’s not exactly a big issue – CACDC #10 (labeled 10 but actually the 5th item on the list).
CACDC first claims that the state employees have been omitted but a little research shows they have been counted but mislabeled in the chart as “Girling Healthcare” employees. Here’s the link to the official State of Texas Sunset Commission audit where you can verify the numbers yourself: http://www.hhsc.state.tx.us/sunset/docs/VI.pdf The convoluted description given this item by CACDC seems almost deceptive.
I’m going to skip past the next few items (lines 6 to 13) because I just don’t have time to analyze them tonight. Maybe AURA can help? Line item 10 (CACDC #21) seems like an easy one to dispel by just counting up bars and restaurants in the subject area.
Picking up at the end, line item 14 (CACDC #32) is obviously flawed. CACDC is here again claiming 1,167 employees at Mueller. As previously shown, the Seton Admin office only has 700 employees. Add in employees at SEDL (100 employees) and Texas Health Research (300 employees) and you’re already at 1,100. I haven’t even counted employees at Dell Children’s Hospital, at the 127,000 sq.ft Strictly Pediatrics building, at the Ronald McDonald house, at Home Depot, Best Buy or the rest of the retail near I-35, or at the HEB shopping center, in the gym and other retail on the 1st floor of the mixed use buildings, at the hotel or the banks.
Another problem with Project Connect is that the projected growth doesn’t match the work CAMPO has been doing to track growth in the Central Texas.
Heres the latest report:
http://www.campotexas.org/wp-content/uploads/2013/08/GM-Report-2008-to-2012.pdf
According to this report, the strong band of growth continues to be the North end of town, the zipcodes directly south of the river, and outlying bedroom communities.
Yet Project Connect has decided that the growth is going to elsewhere because it makes their plan look better. The problem with their projected scenario is people are driven by their commute to work. The employment centers of Austin are the same they have been for the past 20 years (although the tech hub in 7858/7859 is now shifting slightly and going up Mopac) and neither CAMPO nor Austin Chamber of Commerce transportation studies supports these future projections.
I for one, am glad we have citizens scrutinizing this process because something is seriously, seriously wrong in the data sets.