
Project Connect Reality Check: “Lamar” vs. “Highland” sector ridership comparison FAILS
24 November 2013
Despite Project Connect’s startling claim, “Lamar” sector (left) has significantly higher ridership than “Highland” (right). Graph: ARN, from Project Connect data matrix.
♦
During Project Connect’s somewhat eyebrow-raising rollout of the urban rail study team’s much-vaunted route decision at the Central Corridor Advisory Group meeting of November 15th, study director Kyle Keahey valiantly was attempting to combat considerable skepticism surrounding the project by highlighting some of the team’s supposed “findings”.
Perhaps in an effort to demonstrate even-handedness, Keahey had already shown a bar chart illustrating overwhelming popular support for the “Lamar” sector (“sub-corridor” in Project Connect parlance), totaled from public input, but he undoubtedly realized he needed to reveal the team’s “evidence” for their contrary decision. So, trying to justify the selection of the “ERC” (East Riverside) and “Highland” sectors, Keahey assured the audience that “Lamar” (a huge sector of over 4.5 square miles, stretching from east of North Lamar west to Shoal Creek) just didn’t have the desired characteristics.
The Guadalupe-Lamar corridor is well-known for its relatively high transit ridership (after all, it was the top choice for the MetroRapid special bus service planned to open in 2014), so apparently the study team has been hard-pressed to disparage the “Lamar” sector on its strongest points.
So Keahey unveiled a jaw-dropping claim — “Lamar” really doesn’t have the strongest ridership at all, but instead, “actual ridership is highest in East Riverside and Highland ….”
There are several problems with this comparison, starting with the fact that Project Connect has utterly failed to evaluate actual travel corridor ridership (and any other data, for that matter). Instead, the ridership figures (apparently obtained from Capital Metro) apply to all transit ridership, going in all directions. But wasn’t this a study of travel from these sectors to the core area?
One of the problems with this is that those sectors (which include “Highland” and “ERC”) that happen to encompass major transit route interchange hubs suddenly seem to have far more ridership than a sector (like “Lamar”) distinguished for its heavy corridor ridership. This is almost certainly a clear advantage of the “ERC” sector, with clusters of crosstown routes interchanging with UT shuttlebus routes serving student housing and other general routes linking to the core area.
While higher ridership is tallied for “ERC”, this does seem to correlate somewhat with the service level. Altogether, the “ERC” sector has a total of 37 routes, according to Project Connect’s evaluation matrix, compared with 26 for the “Lamar” sector — a ratio of 1.42. This is close to the ratio in “Total Existing Transit Ridership”: “ERC” with 9,648, “Lamar” with 6,990 — a ratio of 1.35. This suggests that ridership may be driven somewhat by the level of service (i.e., number of routes) provided to the sector.
But what about the “Highland” sector? Keahey’s claim that “Highland” currently exhibits higher ridership than the “Lamar” sector was quite shocking, even leaving aside the major interchange at the ACC Highland hub.
And it turns out this claim simply isn’t true — by Project Connect’s own evaluation data matrix.
Project Connect: Central Corridor Sub-Corridor Comparison Matrix
Here’s a screenshot of the page with the transit ridership data:
♦
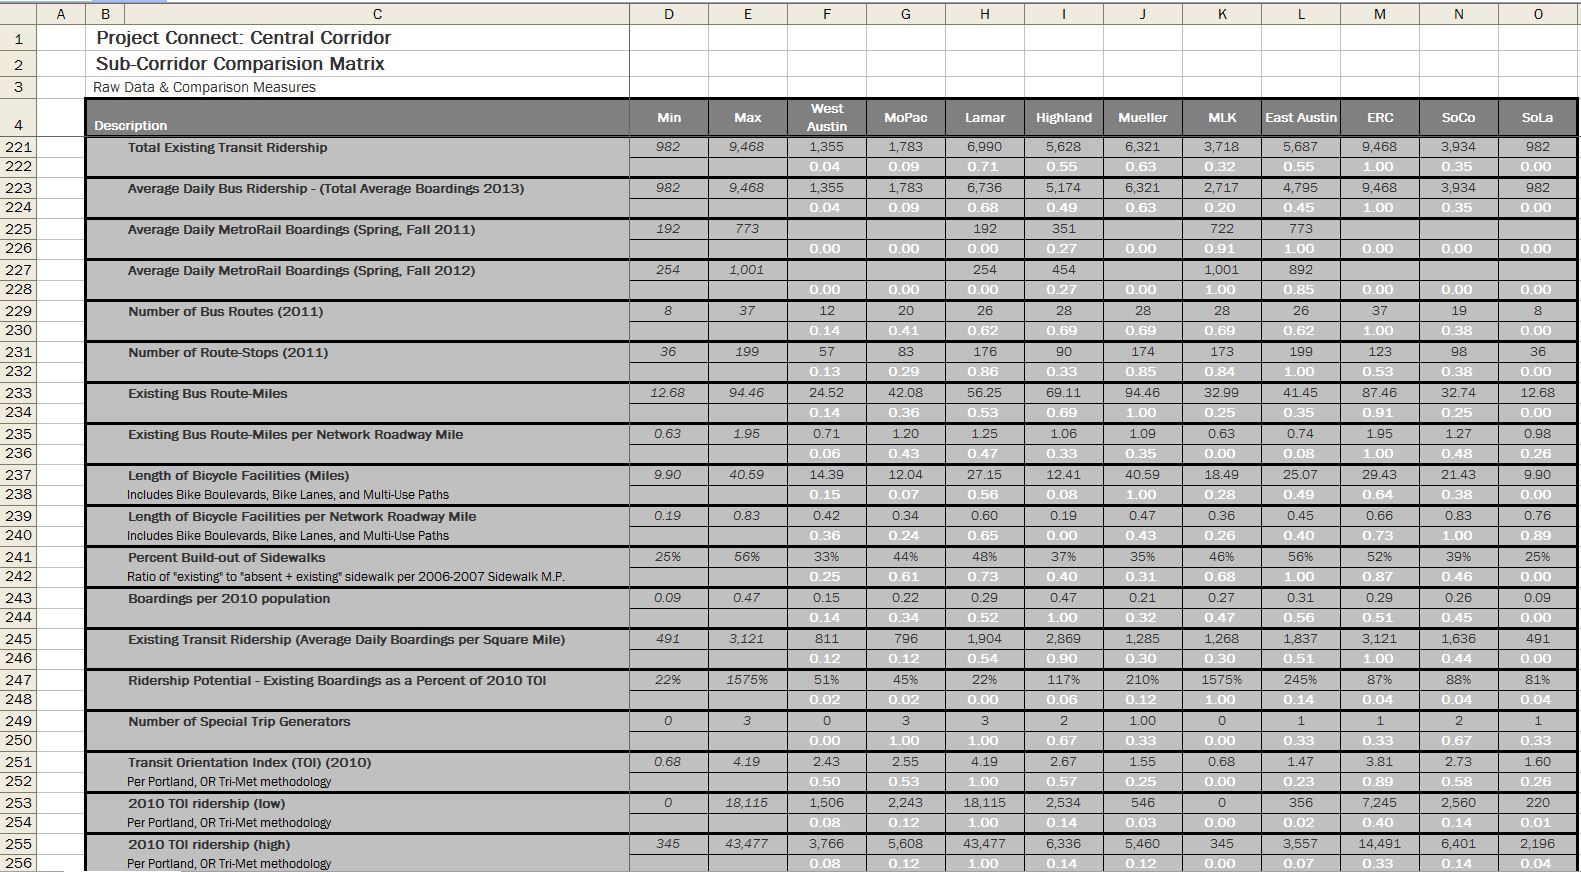
Project Connect Evaluation Data Table page with ridership data.
♦
♦
This screenshot zooms in on the ridership data cells for the “Lamar” and “Highland” sectors:
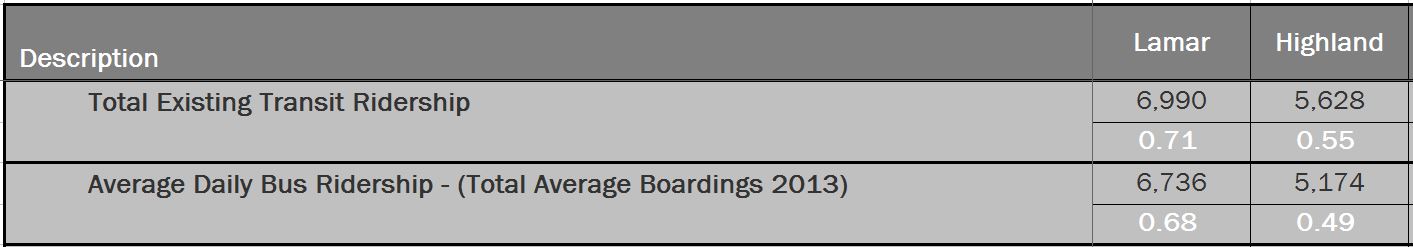
Closeup of matrix data for “Lamar” and “Highland” sectors.
♦
♦
The actual data, above, seem clearly to contradict and refute Keahey’s “bombshell” claim that transit ridership in “Highland” beats that in the “Lamar” sector. By the “Total Existing Transit Ridership” metric, “Lamar” has 6,990, vs. “Highland” with 5,628 — leaving “Lamar” 24% higher (see bar graph at top of post). By the “Average Daily Bus Ridership” metric, Lamar” has 6,736, vs. “Highland” with 5,174 — leaving “Lamar” 30% higher.
Thus, this would seem to be a “bombshell” claim that fizzles…


[…] the debate continues online. Blogs like Austin Rail Now continue to question Project Connect’s recommendation. What do you think about Project Connect’s […]