
Questions for Project Connect
3 December 2013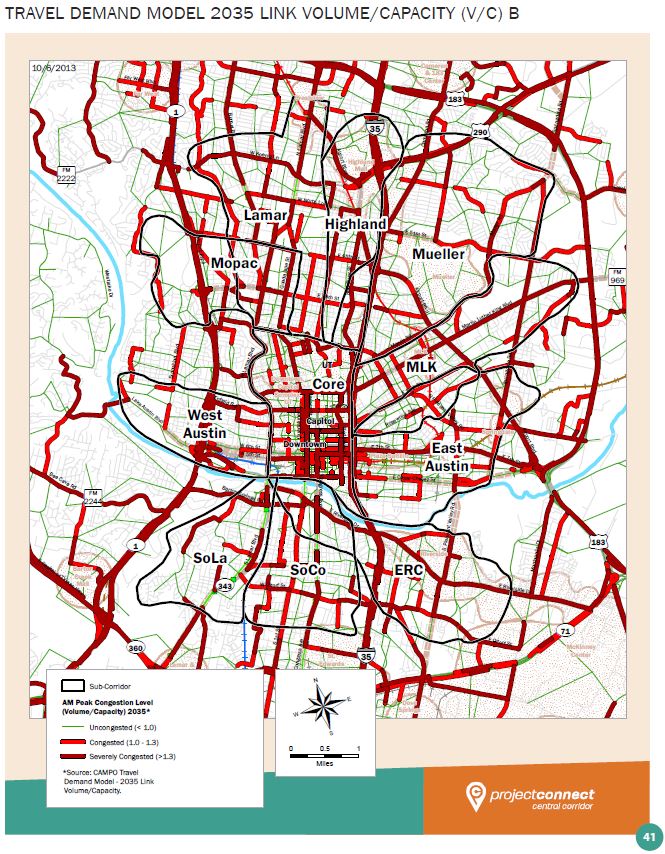
Project Connect’s data visualization of congestion in 2035 for study area sectors shows congestion in every direction. But wasn’t this supposed to be a study to determine best travel corridor to serve core area, not a “beauty contest” among “competing” sectors of the city?
♦
By Lyndon Henry
[These are some of the questions about the urban rail study that I hope to raise today at Project Connect’s “Data Dig” (Capital Metro boardroom, 11:30am-1:30pm).]
• Why has Project Connect’s urban rail study failed to study a single actual potential travel corridor in the study area?
• Why has this study avoided performing an actual corridor study, and instead spent its time (and taxpayers’ dollars) confined to undertaking a de facto inventory (and “beauty contest”) of various urban sectors in isolation?
• Why has this supposed “corridor” study segmented an otherwise viable corridor such as Guadalupe-Lamar into non-sensical pieces, severing it from its most logical destination (core area), and thus creating an arbitrary “rump” route (29th St. to south of U.S. 183) that goes from nowhere to nowhere?
• Why has this study failed to evaluate another logical route plan — the “loop” route using both Guadalupe-Lamar and the Red Line (converted to urban rail), with a spur line into the Mueller site?
• Why has this study used such speculative projections based on procedures that maximize all possible development for targeted areas (such as “ERC”, “Mueller”, and “Highland”), rather than using conservative projections based on conditions closer to reality?
• These same projections have produced bizarrely implausible transit ridership projections — e.g., 2.9 million daily rider-trips for the “ERC” (East Riverside) sector. That’s about as many trips in that single sector of Austin as the total urban ridership of Chicago and Philadelphia combined. That’s the output of the study’s main predictor of transit ridership. With results like that, why hasn’t Project Connect more intensely questioned its own demographic and economic assumptions and projections?
• Why have travel and congestion on major freeways (I-35, Loop 1, U.S. 290) — which are roadway arteries used throughout the urban area — been treated as if they affected only the sectors (“sub-corridors”) they happen to pass through? Why has their congestion been “assigned” only to the “inventory” for those sectors?
• Why has this study’s assessment of “travel demand” from each sector to the core ignored home-based non-work (HBNW) trips — including UT student trips and recreational trips — in a college city with the largest university in Texas in its core area?
• Why has this study, in determining the potential of a specific sector (“sub-corridor”) for supporting an urban rail line from that sector to the core, considered “Regional Trips Passing through Sub-Corridor to Core” — i.e., pass-through trips — as relevant? Why have “Regional O-D Trips Beginning or Ending in Sub-Corridor” been considered relevant to a study focused on trips from a given area to the core? How does this provide any meaningful assessment of need or potential ridership for an urban rail line from any sector (“sub-corridor”) to the core area? Is it plausible that any significant number of motorists traveling from, say, the “Highland” sector to Round Rock or San Marcos would use urban rail to the core for part of the trip?
• Why has this study, for these trips whose validity and relevance for this study is far more dubious, nevertheless included all types of trips — including UT student and recreation trips — while excluding them for the much more valid and plausible trips from each sector to the core (and intra-sector)?
• Does this metric have any purpose other than to produce a particularly high score in this category for the “Highland” sector?
• Why does this study assign an extremely high “Constrained Right-of-Way” penalty to the “Lamar” sector, but not to the “Highland”, “Mueller”, “ERC” sectors? Is Project Connect saying that there are no “Constrained Right-of-Way” problems for “Highland”, “Mueller”, “ERC”? The “Constrained Right-of-Way” penalty seems to be arbitrarily applied to sectors (“sub-corridors”) that the Project Connect team dislikes (e.g., “Lamar”), but withheld from sectors they seem to prefer (e.g., “ERC”, “Highland”, “Mueller”).
• Project Connect’s “Physical Constraints” metric appears to be based on totally subjective value assessments, and no information has been given as to how these value judgements have been developed. Where’s the factual basis for this?
• Because, theoretically, Project Connect hasn’t actually selected an alignment, how can they assign “constraints” to anything? Isn’t this “Physical Constraints” metric premature, since the study is dealing not with actual corridors, but with great, huge, sprawling sectors (“sub-corridors”) in which routes could presumably be considered anywhere?
• For each sector, the study has tallied ridership for Capital Metro transit routes in every direction. How is this relevant in assessing ridership from each sector to the core?
• What is the breakdown of ridership (boardings) for each of the Capital Metro transit routes in each sector included in the total?


None of these questions are needed if the public transportation problem were properly stated, which is how to take people form where they are to where they want to go, quickly, efficiently and cost effectively. None of the Project Connect proposals and ideas fulfills this simple definition. Yet in our midst is citizen Richard Shultz who after studying public transportation as a hobby for over 25 years cam up with an innovative, efficient, cost effective, all people serving solution he calls Cellular Mass Transit, which is detailed on his web site http://www.CMT4Austin.org and which provides from anywhere to anywhere anytime that can be implemented quickly within the CapMetro 1% sales tax revenue for both capital and operations. No Consultant studies or corridor analysis paralysis is needed. CMT provides ubiquitous service we can afford and will attract huge ridership increases and thereby actually reduce congestion and air pollution. Come on people, get real and get behind an Austin bred solution for the good of the entire community.
[…] on their sloppy data collection & analysis, it would be easy to call Project Connect incompetent. But that’s not the […]
[…] • Questions for Project Connect […]