
Reality Check: How plausible are Project Connect’s time/speed claims for Highland-Riverside urban rail plan?
24 August 2014
LEFT: Phoenix’s Metro LRT — similar to Project Connect’s proposed Highland-Riverside line — runs almost entirely in street and arterial alignments, with maximum speed limits, traffic signal interruptions, and sharp turning movements that slow running speed. Average schedule speed: 18.0 mph. (Photo: OldTrails.com) RIGHT: Charlotte’s Lynx LRT runs entirely in an exclusive alignment following a former railway right-of-way. Average schedule speed: 23.0 mph. (Photo: RailFanGuides.us)
♦
In a Blitzkrieg of promotional presentations over the past several months, Project Connect leaders and team members have been touting ambitious travel time and average speed projections for their urban rail project proposed to connect the Highland ACC site with the East Riverside development area. In various presentations, the agency’s Urban Rail Lead, Kyle Keahey, has claimed that the line would provide an average speed of “21 to 22 miles per hour” (impressive, compared to an average of about 25 mph for motor vehicles in urban traffic, and typical local bus transit averages of about 12 mph generally and 4-8 mph running through a in a CBD).
In terms of travel time on Project Connect’s proposed line, the agency has detailed the following:
• From the East Riverside terminus at Grove to the Convention Center downtown (3.9 miles) — 11 minutes
• From the Convention Center to the ACC Highland campus (5.6 miles) — 17 minutes

Screenshot from Project Connect’s June 23rd presentation to Capital Metro board, showing travel time claims for proposed urban rail project. (Click to enlarge.)
However, several anomalies immediately leap out to experienced public transit analysts. First, the distance and time projections provided by the agency — totaling 9.5 miles in 28 minutes — imply an average speed of 20.4 mph, not the “21-22” claimed by Kyle Keahey and other representatives. Second, even an average speed of 20.4 for this type of light rail transit (LRT) service in this kind of application raises professional eyebrows (and considerable skepticism) — mainly because it’s significantly higher than what is commonly characteristic of peer systems.
Light rail transit planners commonly know that lines routes in street and arterial alignments, even reservations, face substantially more constraints to speed than do systems routed in exclusive, private right-of-way (ROW) alignments such as railway corridors, tunnels, viaducts, etc. (This is illustrated in the photo composite at the top of this post.) Some major constraints include: maximum speed limited to traffic maximum speed; operation constrained by traffic signals and cross-traffic; sharper curves and turning movements as route follows street grid. Compared with routes in exclusive alignments, the differentials usually aren’t tremendous, but enough to make a difference in schedule speeds, travel times, and other performance factors.
To illustrate this, and perform a rough comparative analysis, we’ve compiled average speeds from two sources. The first is a comparison on the Light Rail Now website, in an article titled Light Rail Schedule Speed – Faster Than Bus, Competitive With Car, with speeds summarized in the following table:
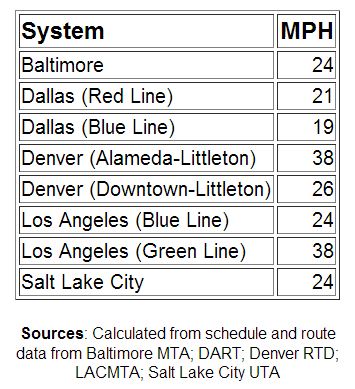
Table of LRT average schedule speeds from Light Rail Now website.
The second source is a recent compilation by Light Rail Now publisher Dave Dobbs, summarized with route lengths, average stop spacing, travel times, and average speeds, in the table below:

Table of LRT average schedule speeds and other data compiled by Dave Dobbs. (Click to enlarge.)
Dave notes that he included the lines he did “because they were examples from Project Connect slides.” He also points out that Project Connect’s East Riverside-to-Highland line “is virtually all street running save for the tunnels and the bridge and I don’t see that much time saving there.”
Indeed, Project Connect’s proposed line is far more of a winding, meandering route, with more traffic speed constraints and sharper turning movements, than any of the comparative peer street-running systems. It includes running in mixed traffic (Red River St.) as well as a segment through the UT campus (San Jacinto Blvd.) with heavy student pedestrian traffic crossing the alignment.
LRT systems are identified with the following designations:
BAL — Baltimore
CHA — Charlotte Lynx
DAL — Dallas DART
HOU — Houston MetroRail Red Line
LA — Los Angeles
MIN — Minneapolis-St. Paul Metro
NFK — Norfolk Tide (Hampton Roads Transit)
PHX — Phoenix Metro
SEA — Seattle Link
SLC — Salt Lake City TRAX
To simplify this comparison, we’ve included clearly identifiable route segments from both table sources, and differentiated them into Predominately Street Alignment and Predominantly Exclusive Alignment categories. For several individual systems, segments are identified in our charts as follow:
Dallas
CBD — West End to Pearl/Arts
Green Line A — West End to Fair Park
Blue Line A — West End to Ledbetter
Blue Line B — West End to Corinth
Blue Line C — Corinth to Illinois
Red Line A — CBD to Plano
Denver
Littleton — CBD to suburb of Littleton
Houston
Red — Red Line
Los Angeles
Blue — Blue Line, CBD to Long Beach
Minneapolis
Blue — Blue Line, Hiawatha
Green — Green Line, Minneapolis-St. Paul
Salt Lake City
701 — Medical Center to Ball Park
704 — West Valley Central to Airport
Sandy — CBD to suburb of Sandy
Using the data from these tabular compilations, we’ve presented a comparative summary of average schedule speeds in the following two graphs. Speed data values (mph) have been rounded to a single decimal point. The first graph presents a comparison of various predominantly street-running lines, similar to Project Connect’s proposed project. This includes an average for the actual, operating peer systems. The second graph presents average speeds for various lines and line segments in exclusive (mostly railway right-of-way) alignments. (Click either graph to enlarge.)


From this comparison, it can be seen that the average speed for Project Connect’s Highland-Riverside line, based on the projected travel time presented by the agency, is significantly above all of the peer systems running predominantly in street right-of-way. Not only does Project Connect’s line show a higher average schedule speed than any of its peer systems, but it’s a full 6.4 mph — nearly 46% — above the peer average. This seems highly implausible, particularly in view of the more convoluted, tortuous profile of the proposed alignment and the other encumbrances we’ve cited. Indeed, the travel time (and implicitly schedule speed) assumptions of Project Connect planners seem more appropriate for the operating characteristics of a route in predominantly exclusive right-of-way rather than running on streets and arterials, as they’ve designed it.
Projecting reasonably accurate travel times and speeds is important to planning any rail transit project, and not just because of plausibility with respect to public scrutiny. Travel time constitutes one of the key inputs into the ridership modeling process. Underestimating travel time, by reducing what’s called the “impedance” to the process of calculating trip generation and modal split, can readily lead to overestimation of ridership. In addition, slow travel speeds also raise the possible need for additional rolling stock to fulfill train frequency and passenger capacity requirements.
Bottom line: Project Connect planners may be estimating faster train travel speeds and shorter travel times than is realistically plausible, and the implications may be lower ridership, greater rolling stock requirements, and possibly higher operating costs than they’ve originally projected. ■


[…] • Reality Check: How plausible are Project Connect’s time/speed claims for Highland-Riverside urban … […]